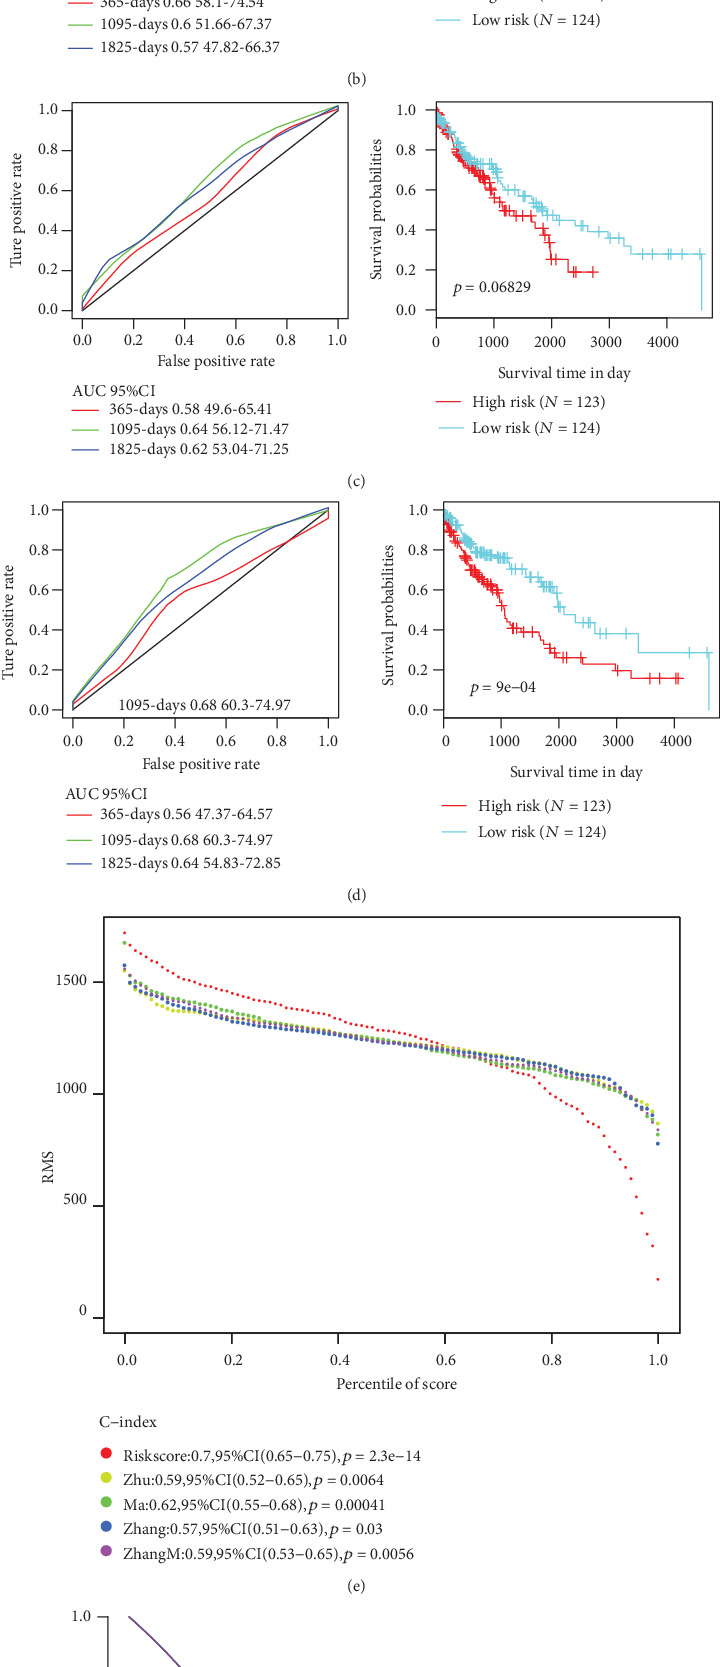
Figure 7.

Comparison and analysis of the 5-gene signature model and other existing models. (a) AUC and KM curves of autophagy-related gene prognostic signature by Zhu et al. (b) AUC and KM curves of immune-related signature by Zhang et al. (c) AUC and KM curves of sixteen-gene prognostic biomarker by Zhang et al. (d) AUC and KM curves of glycolysis-related gene signature by Zhang et al. (e) RMS curves of four models and the 5-gene signature. (f) DCA curves of four models and the 5-gene signature.
