Figure 4.

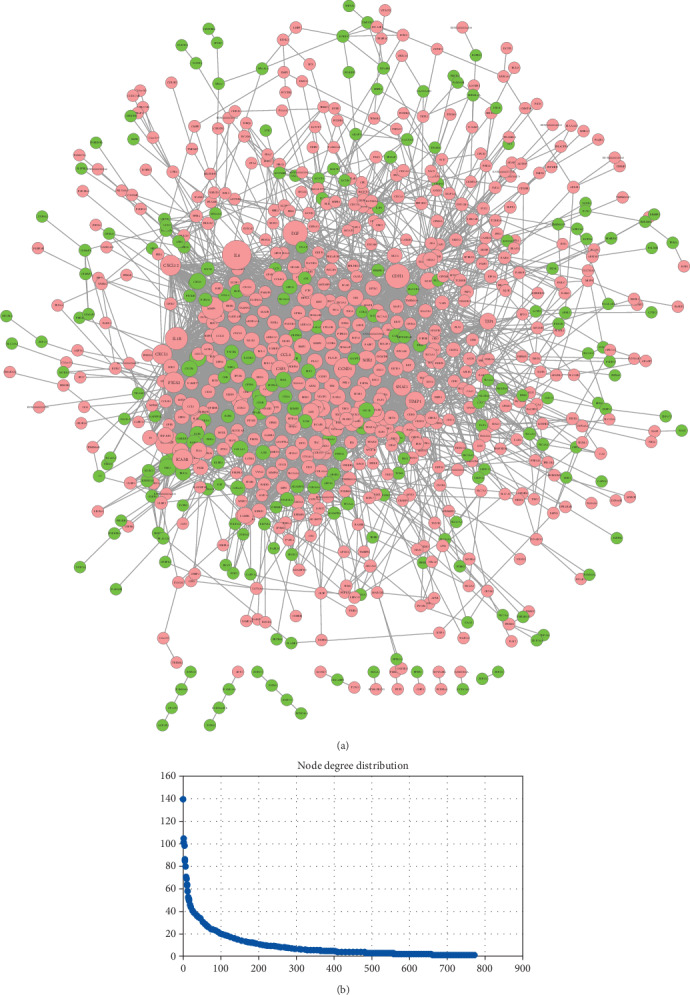
Visualization (a) and node degree distribution (b) of the PPI network. Node size is related to node degree; pink and green nodes denote up- and downregulated genes, respectively.

Visualization (a) and node degree distribution (b) of the PPI network. Node size is related to node degree; pink and green nodes denote up- and downregulated genes, respectively.