
. 2020 Jun 6;2020:5304578. doi: 10.1155/2020/5304578
Copyright © 2020 Dan Huang et al.
This is an open access article distributed under the Creative Commons Attribution License, which permits unrestricted use, distribution, and reproduction in any medium, provided the original work is properly cited.
Figure 7.
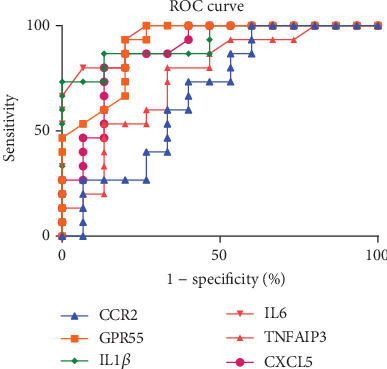
Visualization and details of the ROC curve.