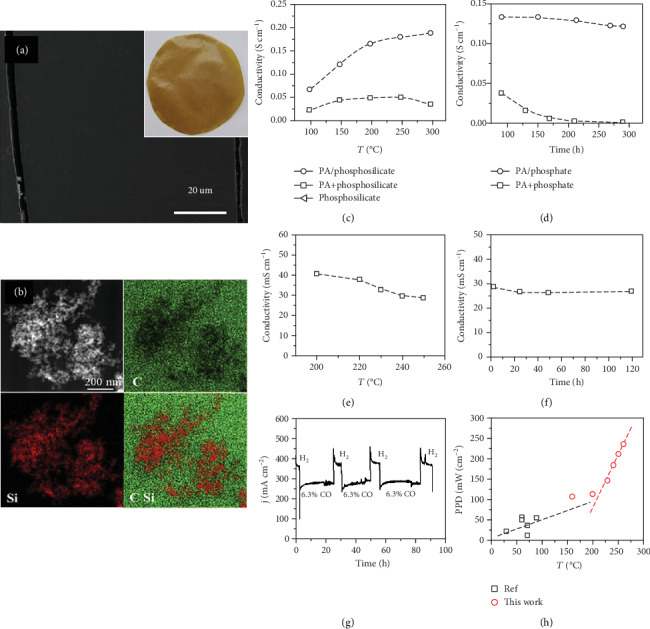
Figure 6.

(a) Cross-sectional microstructure of the PBI/SiO2 membrane. The insert is the optical image of the membrane. (b) STEM-EDS element mapping of the PBI/SiO2 membrane. (c, d) Conductivity plots of PA/phosphosilicate, PA+phosphosilicate, and phosphosilicate composites. (e, f) Proton conductivity and stability of pretreated PA/PBI/SiO2 membrane. Stability data in (d) and (f) were measured at 250°C. (g) CO tolerance of PA/PBI/SiO2 membrane cells, measured at a cell voltage of 0.6 V in pure H2 and 6.3% CO in H2 fuel at 240°C. Air was used as an oxidant [108]. (h) PPD plots of DMFCs with PtRu/C or PtRu/CNT catalyst loading of 1.0-2.0 mg cm−2. Empty square symbols represent references cited in [110].
