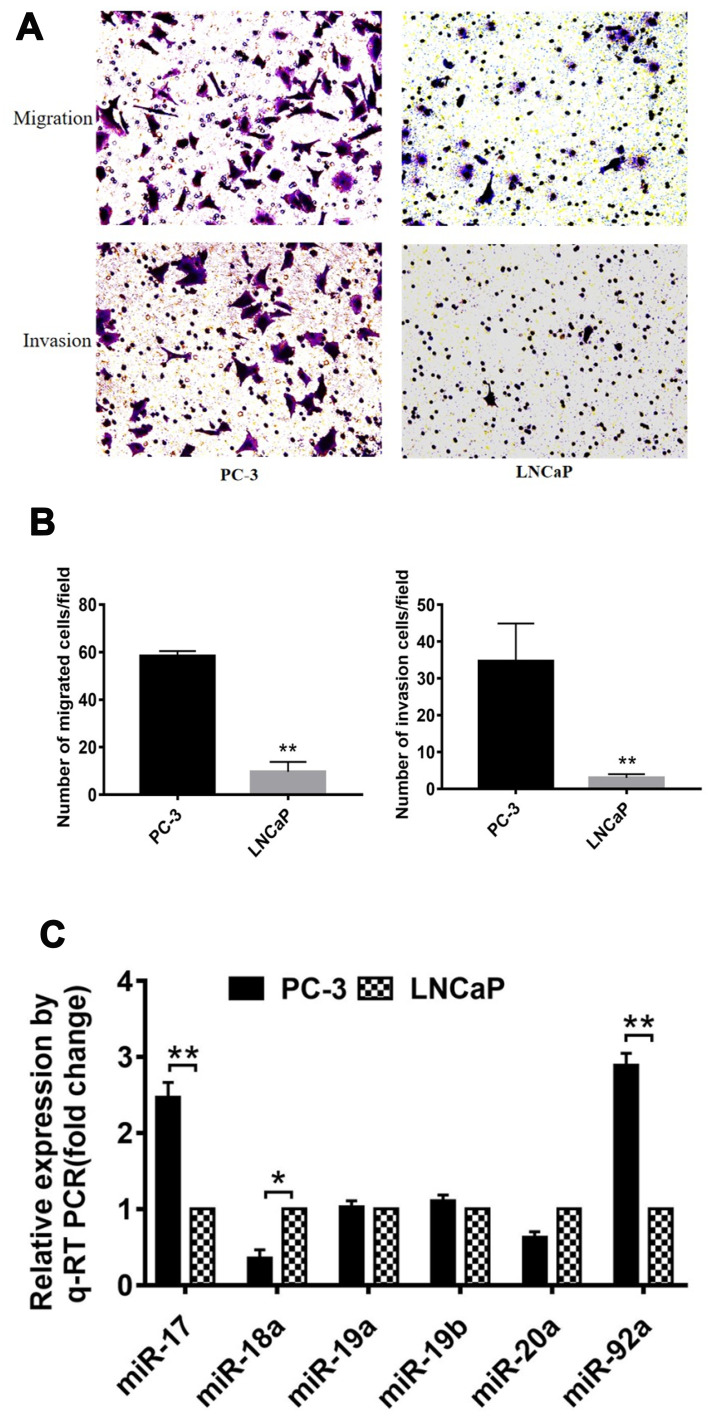
Figure 1.
Comparison of migration and invasion capacity of different PCa cells. (A) Representative images of the lower side of the transwell following the invasion (upper panels) and migration (lower panels) of PC-3 cells (left panels) and LNCaP cells (right panels). (B) Quantitative analysis of cell migration (left) and invasion (right) of PC-3 and LNCaP cells after 12 h. (C) Expression levels of members of the miR-17-92 cluster were detected by qRT-PCR in PC-3 and LNCaP PCa cell lines. For each miRNA, relative expression is given as fold change in PC-3 cells compared with LNCaP cells. * p < 0.05 ** p < 0.01. Per condition three independent experiments were performed.

