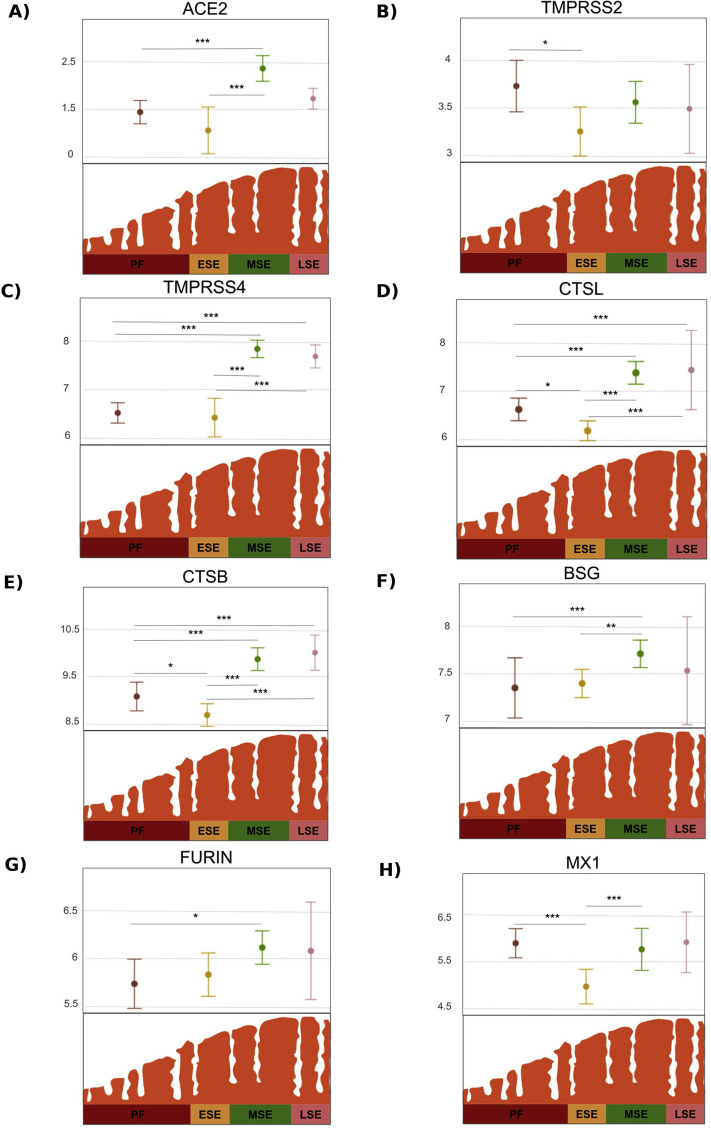
Supplemental Figure 4.
Expression changes across menstrual cycle phases. Gene expression distributions of each viral infectivity related gene are shown for each phase of the menstrual cycle in figures A to H. Statistically significant pairwise t-test results evaluating expression changes between menstrual cycle stages is indicated as ∗P<.1; ∗∗P<.01; ∗∗∗P<.001. ESE = early secretory; LSE, late secretory; MSE = medium secretory; PF = proliferative phase.

