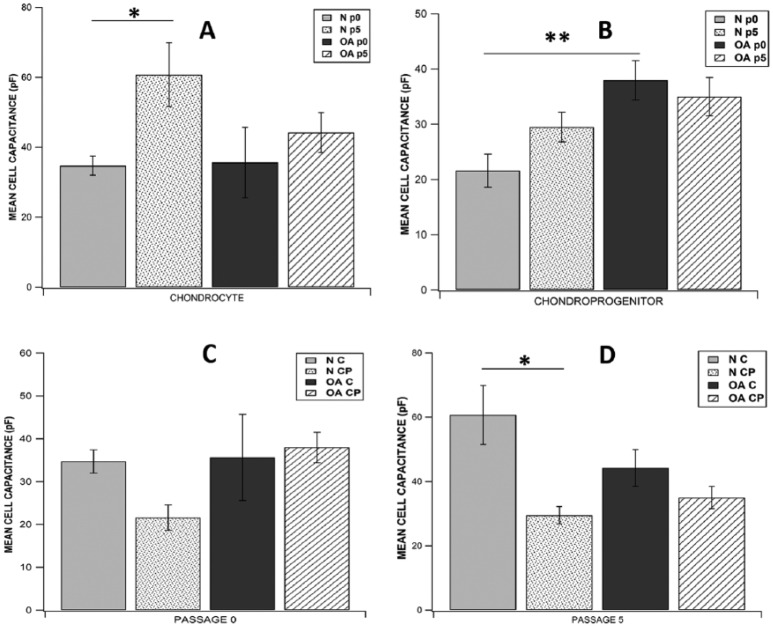
Figure 4.
Comparison of cell capacitance between (A) all chondrocytes subgroups, (B) all chondroprogenitor subgroups, (C) all subgroups at passage 0, and (D) all subgroups at passage 5. Data expressed as mean ± SEM (*P < 0.05, **P < 0.01, using Wilcoxon rank-sum test for A and B; Wilcoxon signed rank test for C and D). N = normal; OA = osteoarthritic; C = chondrocytes; CP = chondroprogenitors; p0 = passage 0; p5 = passage 5.

