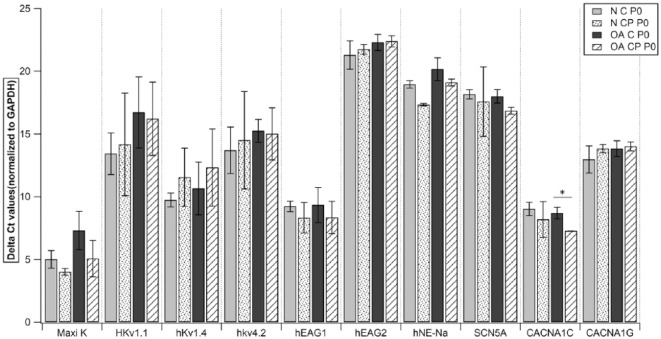
Figure 6.
Quantitative RT-PCR analysis of Maxi K, HKv1.1, hKv1.4, hKv4.2, hEAG1, hEAG2, hNE-Na, SCN5A, CACNA1C, and CACNA1G in all subgroups at passage 0. Data expressed as mean ± SEM (*P < 0.05 using Wilcoxon signed rank test). N = normal; OA = osteoarthritic; C = chondrocytes; CP = chondroprogenitors; p0 = passage 0. Samples taken from n = 3 donors, each sample was run in triplicate.

