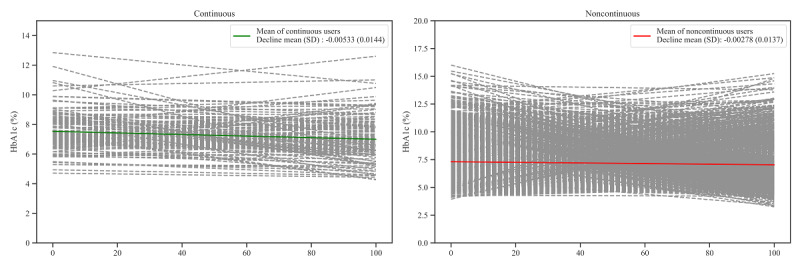
Figure 3.

Hemoglobin A1c (HbA1c) patterns (decline, r-squared value, and SD) of continuous and noncontinuous users. The x-axis is the percentage of days past from the first HbA1c measurement compared with the period between the first and last HbA1c measurements. The dashed lines are the HbA1c decline of each patient. The slope and y-axis intercept of the continuous lines indicates the mean of slope and y-axis of patients, respectively.
