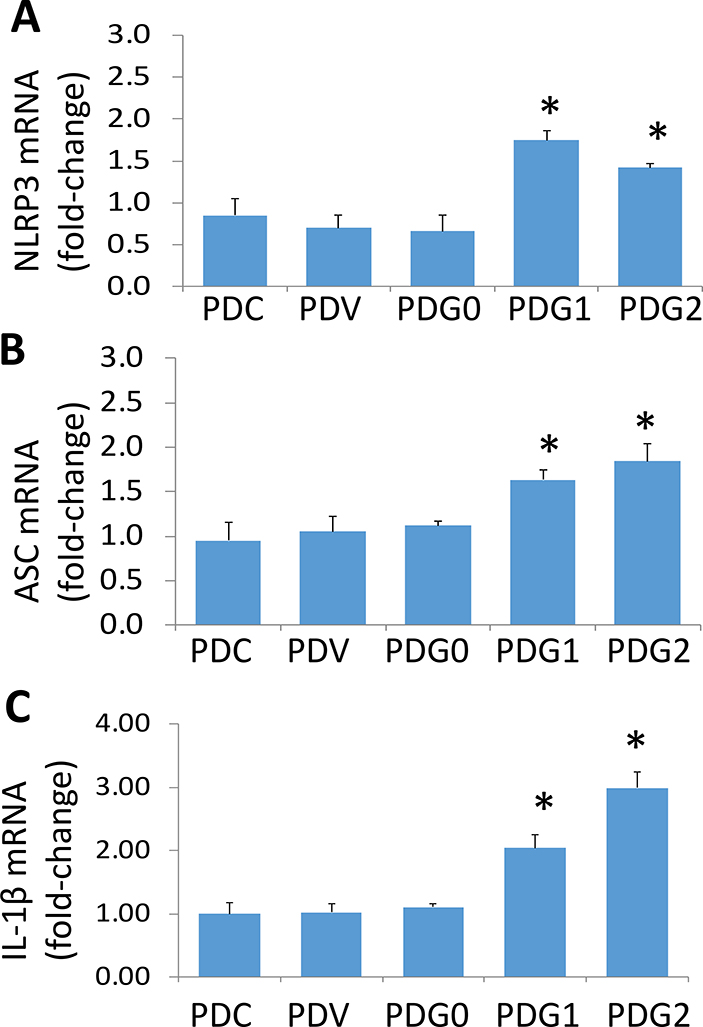
Fig. 2. APOL1 risk alleles enhance transcription of inflammation molecules in podocytes.
RNAs were extracted from the protocol 1A. cDNAs were amplified with specific primers for NLRP3, ASC, and IL-1-β (n=3). Cumulative data are shown in bar graphs. PDG1s and PDG2s displayed enhanced expression of NLRP3 (A), ASC (B), and IL-1β (C) when compared to PDVs, and PDG0s. For statistical analysis, one way ANOVA followed by Tukey multiple comparison test was used.
*P<0.05 compared with respective PDC, PDV, and PDG0.

