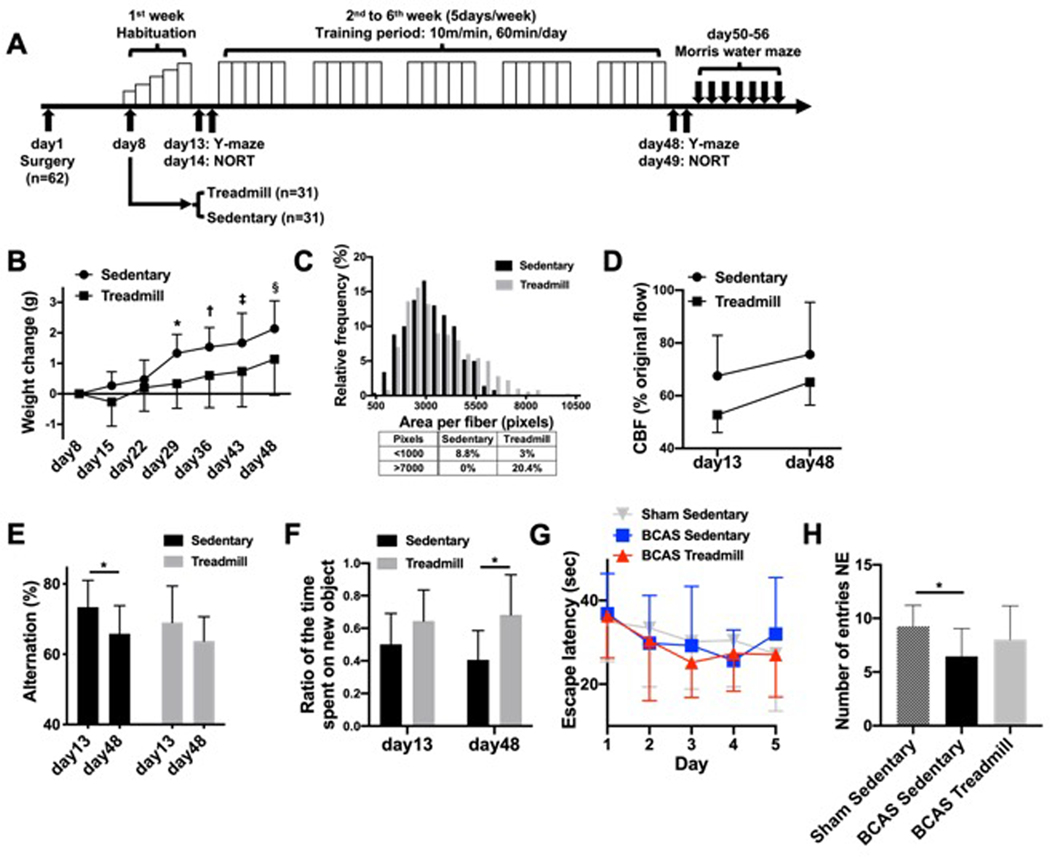
Figure 1.
(A) Schematic overview of the treadmill protocol. Sixty-two BCAS mice were separated into 2 groups (Sedentary: n=31, Treadmill: n=31) 7 days after the surgery. Following a week of habituation period, mice in the treadmill group were placed on a treadmill by which they were obligated to run for 60 minutes/day at the maximum speed of 10 m/min for 5 weeks on weekdays. Y-maze was conducted 2 times, on day 13 and day 48 (n=15/group). NORT was conducted 2 times, on day 14 and day 49 (n=12/group). Water maze was conducted between days 50–56 (n=11–12/group). Please see our supplementary information for the detailed animal numbers for each experiment. (B) Temporal weight change of mice. A significant difference was observed between the 2 groups after day 29 (*, †, ‡, §P<0.05, Sidak’s multiple comparisons test). Data are expressed as mean±SD, with 15 mice for each group. (C) Distribution of the area of muscle fibers showed significant difference between the 2 groups (P<0.05, Mann-Whitney U test). Data are expressed as mean±SD, with 5 mice (100 fibers per mouse) for each group. Representative cross-sectional image of the gastrocnemius muscle was presented in Supplementary Figure S1D. (D) Laser-doppler flowmetry comparing CBF of sedentary BCAS mice and treadmill BCAS mice at day 13 and day 48. No statistical difference was observed between the 2 groups at both time points. Data are expressed as mean±SD, with 4 mice for each group. (E) Change in alternation in Y-maze test before and after the training period. Significant decline was observed only in the sedentary group (*P<0.05, Sidak’s multiple comparisons test). Data are mean±SD from 15 mice for each group. Data for arm entry number were presented in Supplementary Figure S2A. (F) While there was no difference in recognition memory between the 2 groups on day 14, statistical significance was observed on day 49 in NORT (*P<0.05, Sidak multiple comparisons test). Data are expressed as mean±SD, with 11 mice for each group. (G) During the acquisition phase of Morris water maze, no difference was observed in latencies to locate the hidden platform between the sham-operated sedentary group, the BCAS sedentary group, and the BCAS treadmill group. Data are expressed as mean±SD, with 11–12 mice for each group. (H) Result of the probe trial in the Morris water maze test. In comparison to the sham sedentary group, number of entries into the northeast (NE) quadrant which formerly contained a platform in the acquisition phase, was significantly decreased in BCAS sedentary group, but not in BCAS treadmill group (*P<0.05, Dunnett’s T3 multiple comparisons test). Data are expressed as mean±SD, with 11–12 mice for each group.

