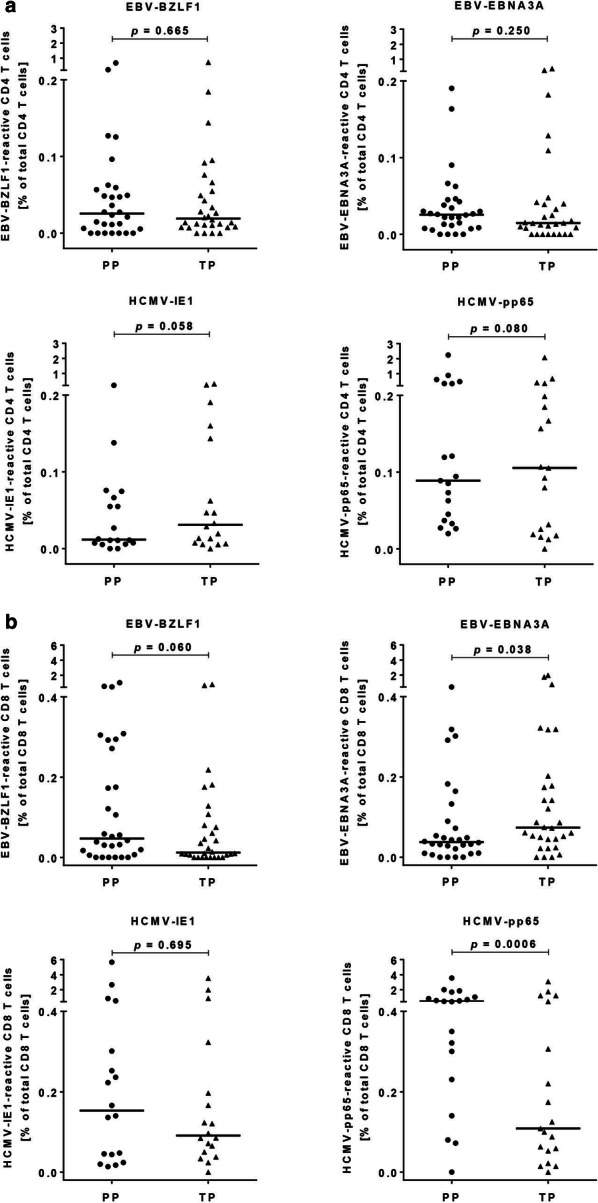
Fig. 1.

Frequencies of EBV and HCMV T-activated protein and peptide pool-reactive CD4 (a) and CD8 (b) T cells. Depicted are the frequencies of antigen-reactive CD4 (a) and CD8 (b) T cells upon stimulation of freshly isolated PBMC with EBV-BZLF1 (n = 30), EBV-EBNA3A (n = 30), HCMV-IE1 (n = 19), and HCMV-pp65 (n = 19) T-activated proteins and the corresponding peptide pools. Dots and triangles represent frequencies of antigen-reactive T cells of single donors after re-stimulation of PBMC with PP (left, dots) and TP (right, triangles), respectively. Frequencies of antigen-reactive T cells were calculated as the sum of IFN-γ, TNF, and IL-2 producing CD4 or CD8 T cells (defined as total response) expressed as a percentage in relation to total CD4 or CD8 T-cell numbers. The horizontal lines indicate the medians. Statistical analyses were done with paired Wilcoxon signed rank tests. PP peptide pool, TP T-activated protein
