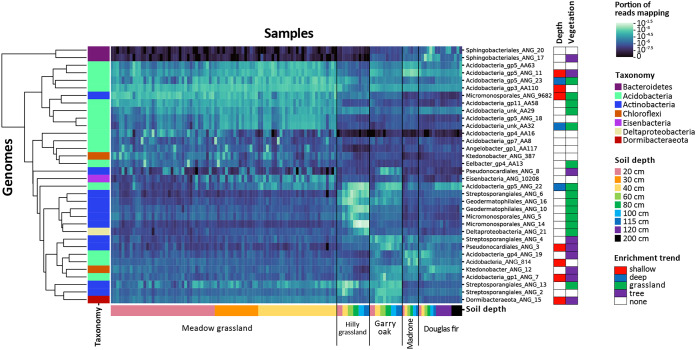
FIG 6.
Abundance of genomes with highest biosynthetic potential across sampling sites and environments. All genomes from the dereplicated set (n = 1,334) with at least 15 total biosynthetic domains were included. Lighter heat map color, shown in log scale, indicates a higher portion of the reads in a sample (columns) mapping to a genome (rows). Genome rows were clustered based on similar abundance patterns. Genome taxonomy is shown in the left vertical colored bar. Samples are grouped by site and vegetation (black vertical lines) and then by soil depth (shown in horizontal colored bar). Environmental enrichment trends for each genome, as determined by DESeq, are shown in the “Depth” and “Vegetation” columns on the right.

