FIG 1.
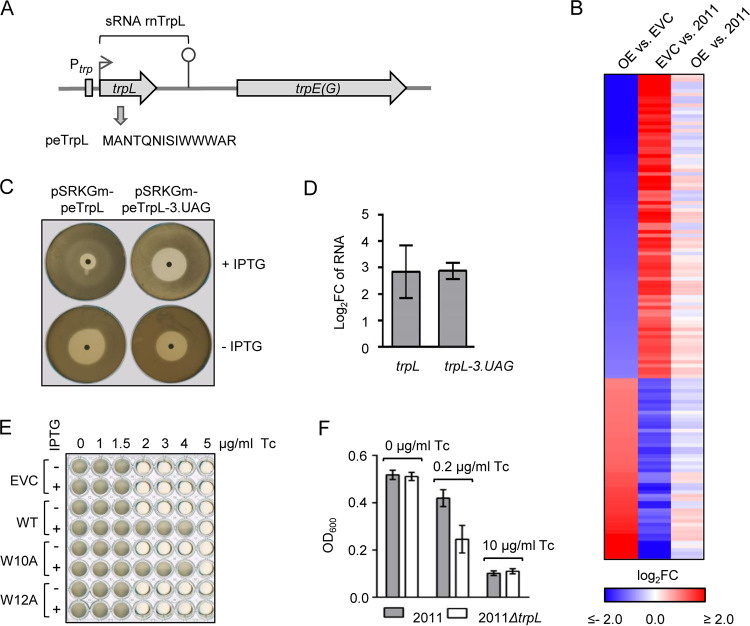
The leader peptide peTrpL increases the resistance to Tc. (A) Scheme of the S. meliloti trpLE(G) locus. The transcription start site and transcription terminator of the trp attenuator are depicted by a flexed arrow and a hairpin, respectively. The trans-acting products of the trp attenuator, the sRNA rnTrpL, and the leader peptide peTrpL, are indicated. (B) Heat map with RNA-seq data of the following strains: OE, overexpressing strain 2011 (pRK-rnTrpL); EVC, empty vector control 2011 (pRK4352); 2011, parental strain. The heat map shows results for 135 genes with strong differences (log2 fold change [FC] >2.0 or <−2.0) in the comparisons of OE versus EVC and EVC versus 2011, which had no or low differences (log2 FC >−0.5 or <0.5) in the comparison of OE versus 2011 (see Data Set S1 in the supplemental material). (C) Representative agar plates with zones of growth inhibition by centrally applied Tc. S. meliloti 2011 ΔtrpL harboring the indicated plasmids was used. Presence of IPTG in the agar is indicated. (D) qRT-PCR analysis of the increase in trpL and trpL-3.UAG mRNA levels 10 min after IPTG addition to liquid cultures of strains used in panel C, in comparison to the EVC. (E) Growth of S. meliloti 2011 ΔtrpL harboring pSRKGm (EVC) or its derivatives allowing for production of peTrpL (WT), peTrpL-W10A, or peTrpL-W12A in microtiter plates, in medium with increasing Tc concentrations (given at the top). Presence of IPTG in the medium is indicated. Shown is a representative plate with final bacterial growth. (F) OD600 reached overnight by the indicated strains in microtiter plates, in medium containing the given Tc concentrations. The graphs show data from three independent cultures (mean ± standard deviation).

