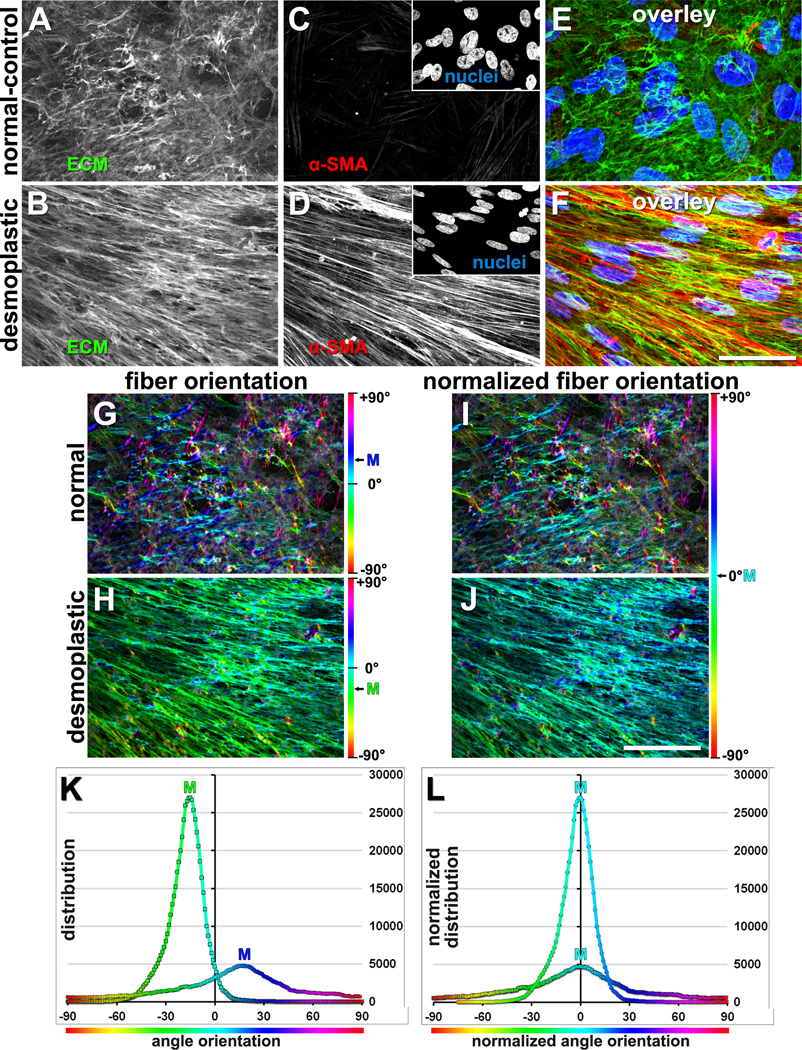
Figure 4. Unextracted fibroblastic cell-derived 3D ECM (fCDM) phenotypes.
(A-F) Confocal indirect immunofluorescence reconstructed images, representative of assorted 3D unextracted human pancreatic primary fCDM cultures. Compare normal vs. desmoplastic (i.e., myofibroblastic activated) phenotypic characterization including monochromatic matrix (i.e., fibronectin; A-B) and α-SMA (C-D) images, with corresponding nuclei images in the inserts. Matching color overlaid images are shown in panels E and F; green=fibronectin, red=αSMA and blue=nuclei. G and H panels exemplify OrientationJ software’s visual outputs obtained from the analysis of fibronectin fibers in A and B. Color gradient bars to the right represent the orientation angles assessed by the software, while the corresponding mode angle color is shown for each image. I and J are the resultant Hue-corrected images displaying mode angle in Cyan representing normalized image/color (i.e., 0°). Note how color variations are diminished in the desmoplastic example where the majority of fibers are parallel oriented. Bars represent 50 μm. Graphs in K represent numeral outputs obtain from G and H, while L corresponds to the normalized distributions (similar to approach in I and J). Image was adapted from Franco-Barraza, J., et al., Preparation of Extracellular Matrices Produced by Cultured and Primary Fibroblasts. Curr Protoc Cell Biol, 2016. (Franco-Barraza et al., 2016). Copyright © 2016 John Wiley & Sons, Inc.

