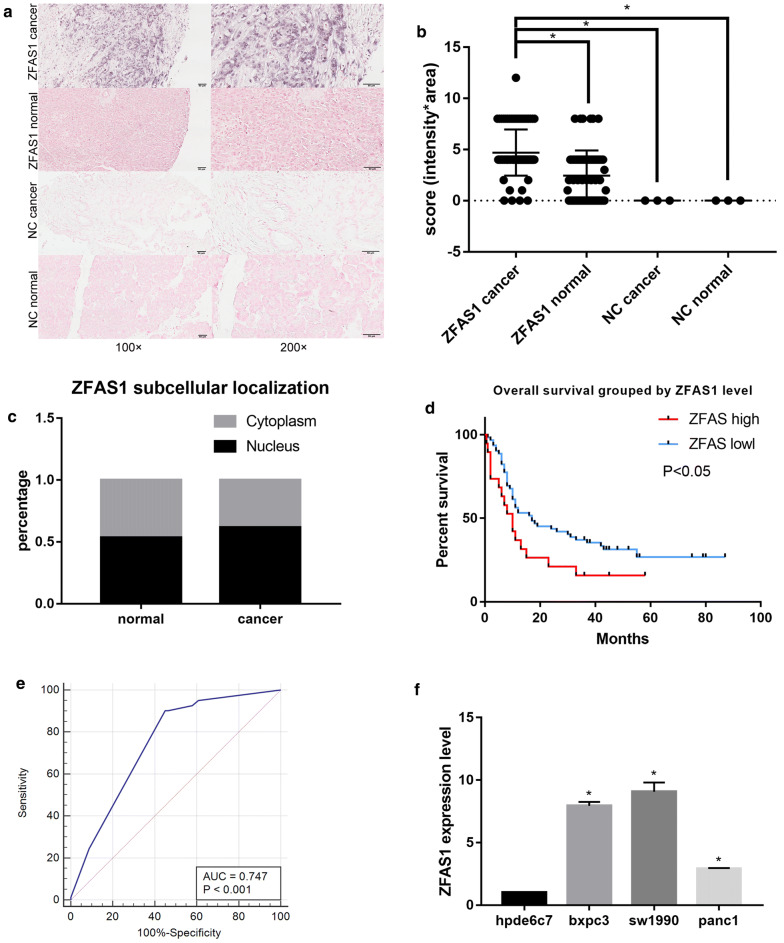
Fig. 2.
Identification of ZFAS1 overexpression and clinical correlations in PAAD by experimental analysis. a ZFAS1 expression in PAAD (n = 83) and normal tissue samples (n = 69) determined by ISH; scale bars, 50 μm. b Different ZFAS1 expression scores (intensity*area) in PAAD (n = 83) and normal tissue samples (n = 69) measured by ISH, p < 0.05. c ZFAS1 subcellular localization and expression level. d Kaplan–Meier survival analysis of PAAD patients stratified according to their ZFAS1 expression level, p < 0.05. e ROC curve showing the AUC for ZFAS1 (0.747, 95% CI 0.670–0.814), p < 0.05. f Relative ZFAS1 expression levels in PAAD cell lines and a human pancreatic ductal epithelial cell line measured by qRT-PCR (n = 3), *p < 0.05

