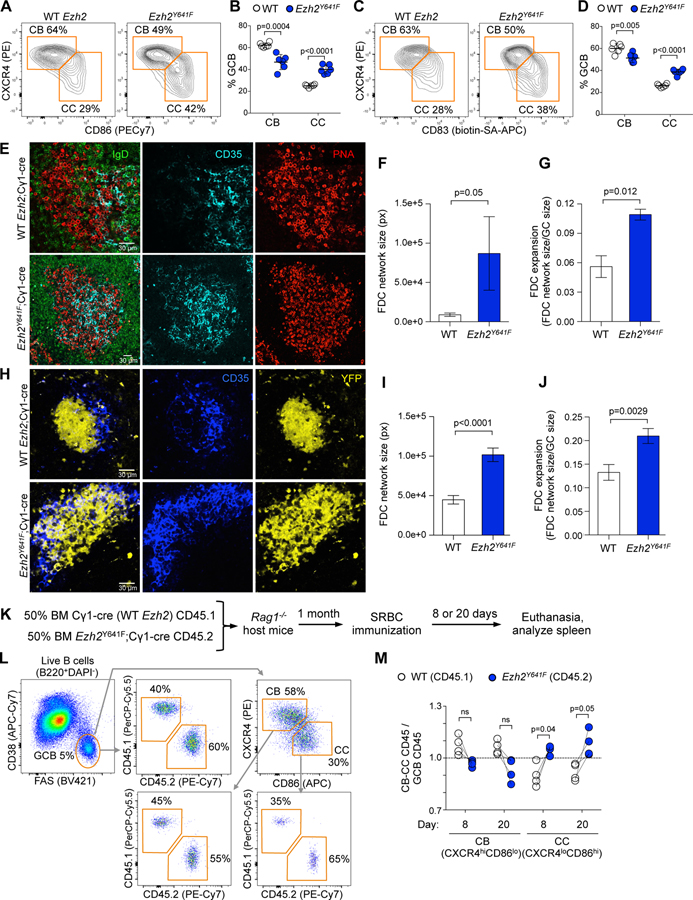
Figure 2. Mutant Ezh2 induces LZ expansion.
A. Ezh2Y641F and WT mice were SRBC-immunized for 8 days and spleens analyzed by flow cytometry. Centroblasts (CB) and centrocytes (CC) were gated from GC B cells.
B. Percentage of CBs and CCs shown in A. Each dot represents a mouse (n=6), mean ± SEM; unpaired t tests.
C. Flow cytometry data of splenocytes shown in A, using a different CC marker.
D. Percentage of CBs and CCs shown in C. Data shown as in B.
E. IF confocal microscopy images of splenic GCs at day 8 post-SRBC.
F-G. Quantification of FDC network size (F) and expansion (G) from IF images from 3 WT and 3 Ezh2Y641F; mean ± SEM; unpaired t tests.
H. IF confocal microscopy images of YFP splenic GCs at day 8 post-SRBC. Mice were injected with anti CD35-BV421 to mark FDCs.
I-J. Quantification of FDC network size (I) and expansion (J) from IF images from 5 YFP;Ezh2Y641F and 5 YFP;Cγ1-cre mice; mean ± SEM; unpaired t tests.
K. WT BM (CD45.1) mixed with Ezh2Y641F BM (CD45.2) was injected into Rag1-/- mice, SRBC-immunized and euthanized 8 or 20 days later.
L. Gating strategy of splenocytes of one representative sample.
M. Flow cytometry data was analyzed by normalizing the percentage of CD45.1+ CBs (CXCR4hiCD86lo) and CCs (CXCR4loCD86hi) to their parental CD45.1+ GC B cells (CD38-FAS+), and equivalent normalization with CD45.2+ populations. Each pair of connected dots represents a mouse (n=4); paired t tests.
Results representative of 3 to 4 experiments.
See also Figure S2.

