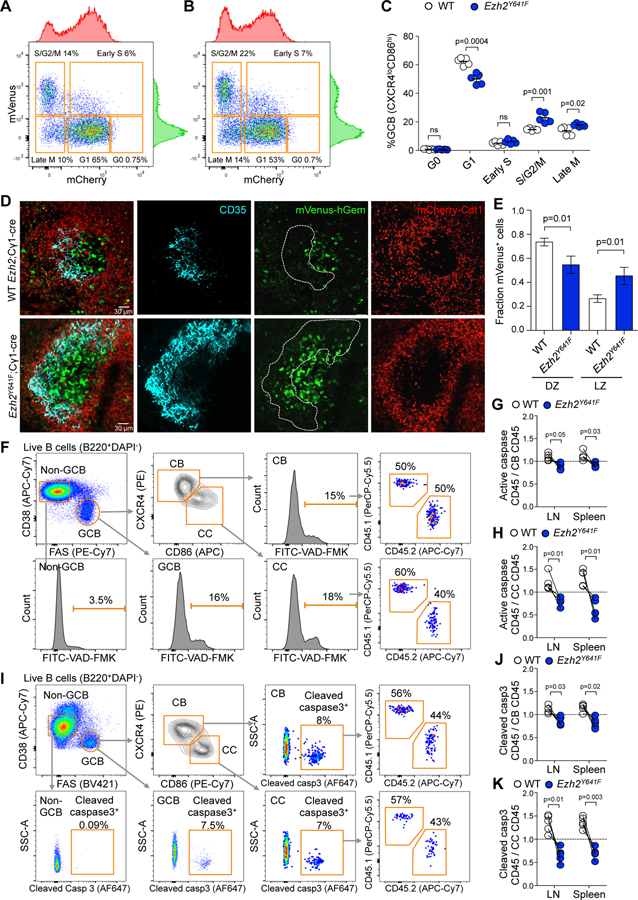
Figure 3. Ezh2 mutation causes aberrant proliferation and less apoptosis in the LZ.
A-B. Flow cytometry plots of splenic CCs (CXCR4loCD86hi) of R26-Fucci2aR;Cγ1-cre (A) and R26-Fucci2aR;Ezh2Y641F (B) mice immunized with SRBC for 8 days.
C. Percentage of CCs shown in A and B at different cell cycle phases. Each dot represents a mouse (n=5), mean ± SEM; unpaired t tests.
D. IF confocal microscopy images of R26-Fucci2aR splenic GCs at day 8 post-SRBC. Mice were injected with anti CD35-BV421 to mark FDCs.
E. Quantification of proliferating mVenus+ cells in images taken from 4 R26-Fucci2aR;Cγ1-cre and 4 R26-Fucci2aR;Ezh2Y641F mice; mean ± SEM; unpaired t tests.
F. Gating strategy of lymph node cells of mixed chimera mice generated as in Figure 2K and immunized with NP-OVA for 8 days. Apoptosis was assessed using VAD-FMK pan-caspase inhibitor.
G-H. The percentage of CD45.1+ VAD-FMK+ splenocytes and lymph node (LN) cells was normalized to their parental CD45.1+ CBs (G) and CCs (H), and equivalent normalization with CD45.2+ populations, gated as shown in F. Each pair of connected dots represents a mouse (n=4); paired t tests.
I. Gating strategy of splenocytes of mixed chimera mice immunized with NP-OVA for 8 days. Apoptosis was assessed using an anti-cleaved caspase 3 antibody.
J-K. The percentages of CD45+ cleaved caspase 3+ cells shown in I were normalized to parental CBs (J) and CCs (K), and quantified as in G-H; n=4, paired t tests.
Results representative of 3 experiments.
See also Figure S3.

