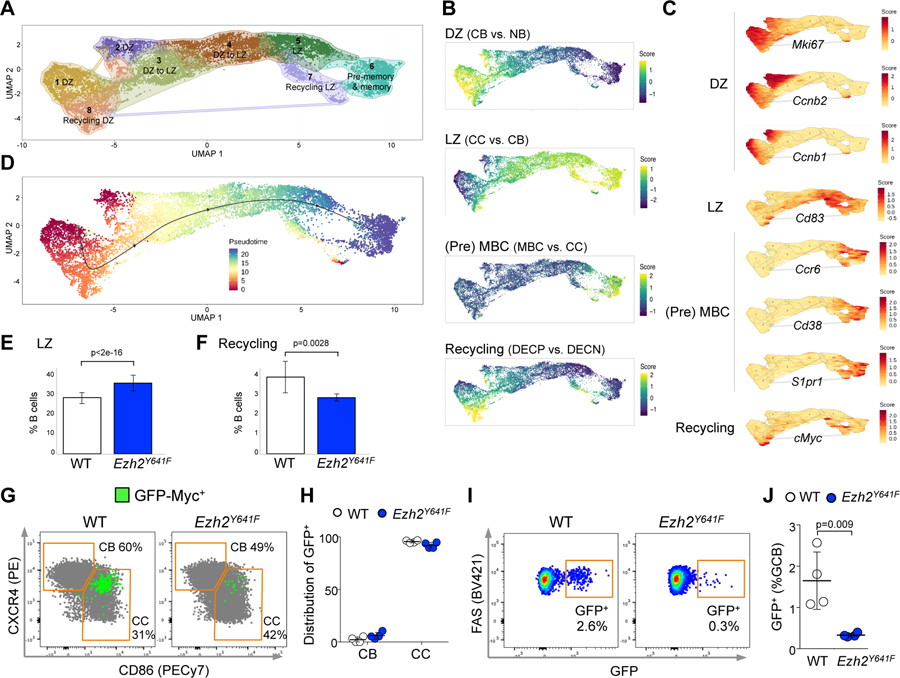
Figure 4. Mutant Ezh2 centrocytes fail to re-enter the DZ.
A. YFP+IgD- splenocytes sorted from 3 YFP;Ezh2Y641F and 3 YFP;Cγ1-cre mice immunized with SRBC for 8 days were subjected to single cell RNA-seq. Dimensionality reduction with UMAP was performed on normalized gene expression values, using graph based clustering and K nearest neighbor analysis to assign cells to clusters with distinct expression profiles.
B. Mature B cell signatures were projected on clusters defined in A. MBC: memory B cell. DECP are positively selected GC B cells (Ersching et al., 2017).
C. Specific gene expressions were projected on clusters from A. D. Gene expression profiles were organized into a pseudotime vector by Slingshot.
E-F. After normalization for total number of analyzed cells, the abundance of Ezh2Y641F and WT was calculated for CC (LZ) (E) and recycling cells (F), based on the projected signature score from (B); data are mean ± SE (n=3 mice), p values generalized linear model.
G. GFP-Myc mice were SRBC-immunized for 8 days and spleens analyzed by flow cytometry. CBs and CCs were gated from GC B cells.
H. Total GFP+ GC B cells were assigned to CBs and CCs, gated as shown in G. Each dot represents a mouse (n=4), mean ± SEM.
I. Flow cytometry plots showing the percentage of GFP+ cells among GC B splenocytes from GFP-Myc mice.
J. Quantification of GFP+ cells among GC B splenocytes from 4 GFP-Myc;Ezh2Y641F and 4 GFP-Myc;Cγ1-cre mice; mean ± SEM; unpaired t test.
Results representative of 2 experiments.
See also Figure S4.

