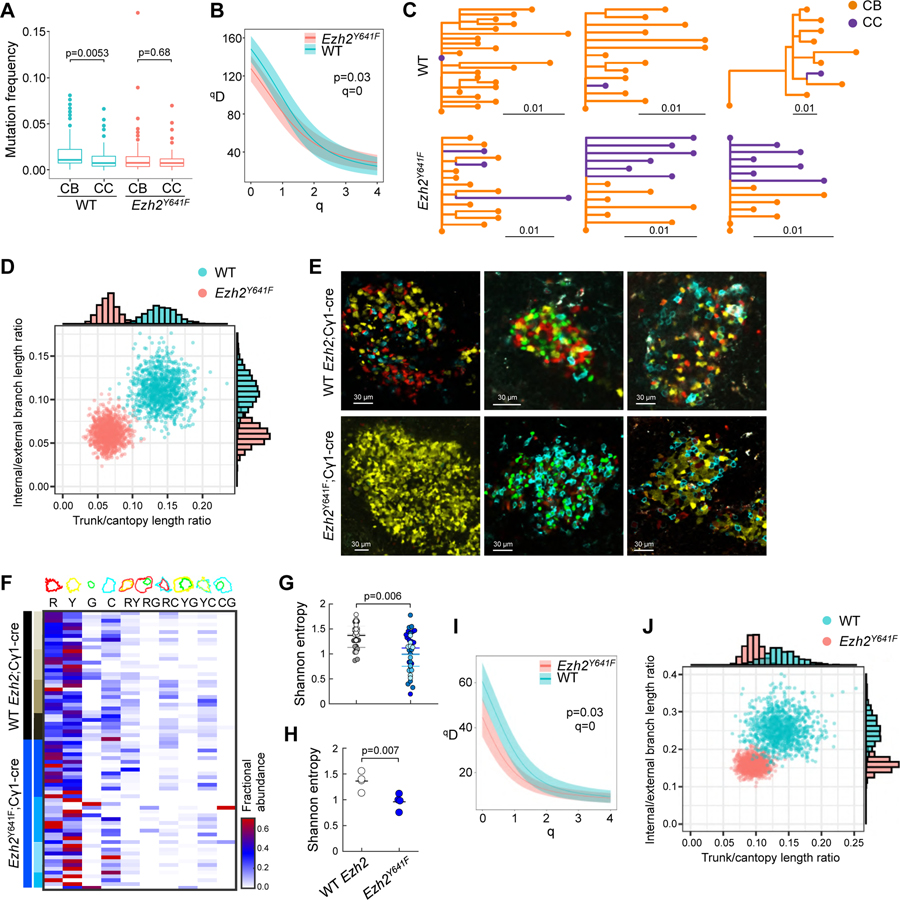
Figure 7. Ezh2 mutation induces reduction in clonality.
A. Mutation frequency of V segments (n=3 mice), measured in proportion of mismatched nucleotide sites between each V segment of each sequence and its predicted germline V segment; p values Wilcoxon rank sum test.
B. Diversity curves of YFP;Cγ1-cre (WT) and YFP;Ezh2Y641F mice generated through 1000 uniformly sampled bootstrap replicates.
C. Lineage trees of three largest WT and Ezh2Y641F YFP mice.
D. Distribution of 1000 bootstrap replicates showing total trunk/canopy (non-trunk) branch length ratio and internal/external branch length ratio of lineage trees obtained from WT and Ezh2Y641F YFP mice. Marginal histograms of each statistic are shown on the top and right sides.
E. IF confocal microscopy images of R26R-Confetti splenic GCs at day 10 post-SRBC immunization.
F. Heatmap representing quantification of clonal abundance from GCs derived from 4 R26R-Confetti;Cγ1-cre and 4 R26R-Confetti;Ezh2Y641F mice. Scale from white to red denotes the fractional abundance of each clone.
G-H. Shannon entropy was calculated per GC (represented by dots, with each color representing GC from a different mouse, n WT=34, Ezh2Y641F=39) (G) and for all GCs per mouse (H).
I. Diversity curves of R26R-Confetti mice generated as in B.
J. Distribution of lineage trees obtained from R26R-Confetti mice analyzed as in D.
See also Figure S7.

