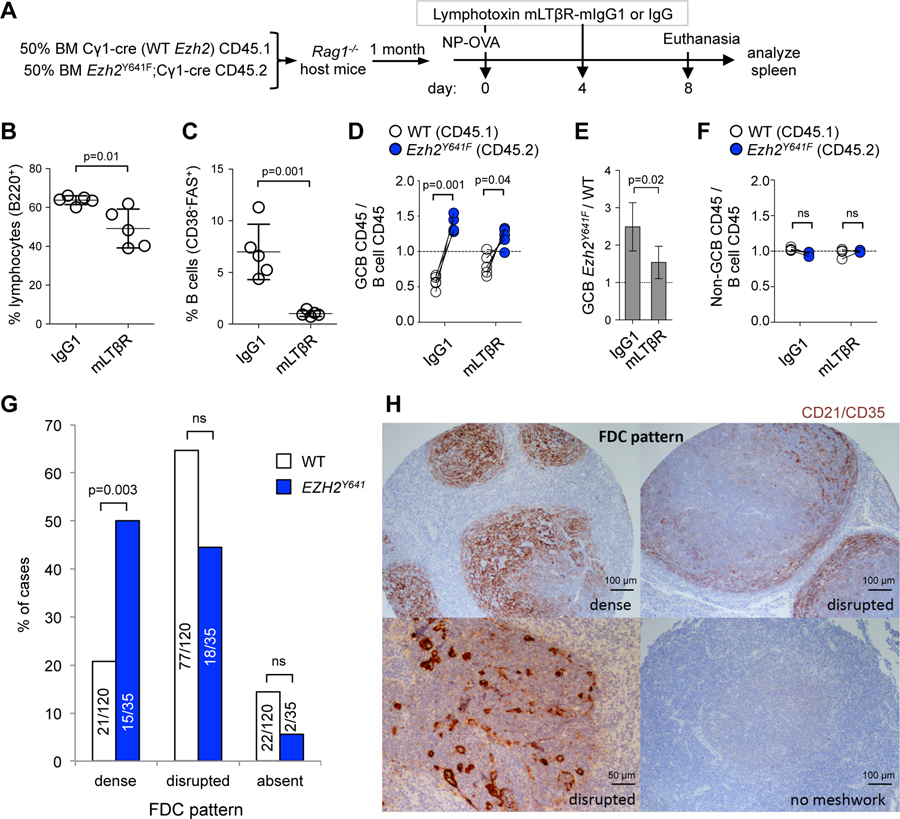
Figure 8. Ezh2Y641F GC B cells switch from T cell to FDC dependency.
A. Mixed chimera mice (n=5) immunized with NP-OVA were treated with two doses of 100 µg lymphotoxin mLTβR-mIgG1 or control IgG antibody.
B-C. Effect of mLTβR-mIgG1 was evaluated by flow cytometry in splenic B cells (B) and GC B cells (C); data are mean (n=5) ± SEM; unpaired t test.
D. GC B cells collected as shown in A were analyzed by flow cytometry, by normalizing the percentage of CD45.1+ GC B cells (CD38-FAS+) to their parental CD45.1+ B cells (B220+DAPI-), and equivalent normalization with CD45.2+ populations. Each pair of connected dots represents a mouse; paired t tests.
E. Ratio of Ezh2Y641F to WT GC B cells from D; mean ± SEM; unpaired t test.
F. Analysis of non-GC B cells (CD38+FAS-) was done as in D.
G. Analysis of FDC patterns in a tissue microarray with 155 grade 1 or 2 FL samples (120 WT + 35 EZH2Y641); p values Fisher’s exact test.
H. FDC patterns were clasified based on the expression of CD21/CD35 by IHC.

