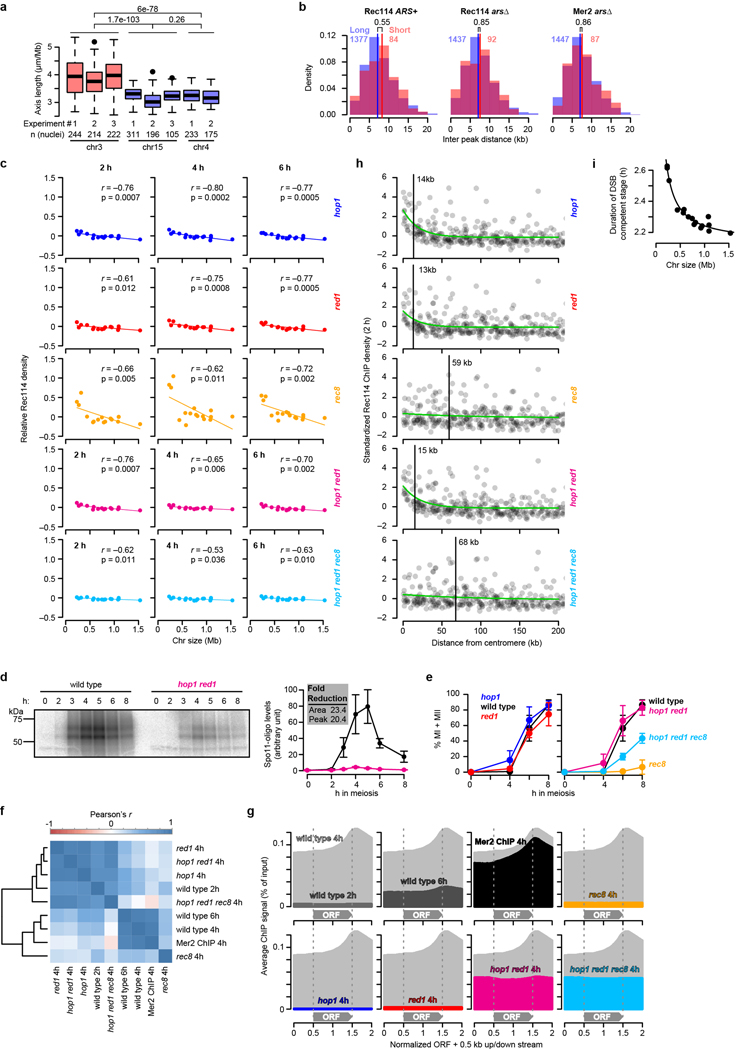
Extended Data Figure 7. Effect of chromosomes axis proteins on Rec114 chromatin binding patterns.
a, Long axes on chr3. To assess axis lengths, we used published measurements from Zhang, Kleckner et al. of synaptonemal complexes (SC) on pachytene chromosomes (Supplemental Table 1 from ref. 31). In that study, spread, immunostained SCs were traced from the positions of lacO arrays (bound by LacI-GFP) integrated at the right end of chr3, chr4 or chr15 to the left end of each chromosome. We therefore used the SK1 genome assembly coordinates41 of the lacO integration sites to estimate the nucleotide length corresponding to the SC measurement (0.30 Mbp for chr3, 1.48 Mbp for chr4, and 0.99 Mbp for chr15) and calculated the per-Mbp axis lengths. Boxplots summarize results from eight independent experiments in wild type including SC length measured by Zip1 (experiments #1 and #2) or Rec8-HA (#3) staining. Note that the greater variance for chr3 is a consequence of the absolute measurement error (in μm) being a much larger fraction of the total chromosome length compared to the longer chromosomes. Data were pooled by chromosome for application of two-sided Wilcoxon tests. Boxplots are as described in Extended Data Fig. 2c.
b, Distributions of inter-peak distances. To ask if the preferential binding of DSB proteins on short chromosomes is due to presence of a higher density of DSB protein binding sites, we measured the distribution of the distances between DSB protein ChIP-seq peaks. Vertical bars indicate medians. Colored numerals above histograms indicate the number of distance measurements. Black numerals are p values from one-sided Wilcoxon tests. There was no significant difference (p > 0.05) between short and long chromosomes in any dataset, indicating that the density of preferred binding sites does not track with chromosome size. DSB protein binding sites correspond to sites where Hop1, Red1, and Rec8 are also enriched, i.e., presumptive sites where DNA is most likely embedded in the axis3,42. How then to reconcile the similar DSB protein binding site densities between short and long chromosomes with the longer per-Mbp axis length on chr3 (panel a)? Importantly, the preferred binding sites are defined on a population average basis. Therefore, one straightforward interpretation is that smaller chromosomes have more of their potential DSB protein binding sites axis-associated in each cell, while larger chromosomes are more likely to have loops that skip over preferred axis sites. This would yield smaller loop sizes and correspondingly longer axes on the short chromosomes despite a similar density of preferred axis sites per unit length of DNA.
c, Chromosome size dependence of Rec114 binding to chromosomes is lost in the absence of Hop1 or Red1, but not Rec8. Results are presented as in Fig. 4b. Note that, although correlations with chromosome size remain statistically significant in both the hop1 and red1 mutants, their slopes are negligible compared to wild type (Fig. 1e). n = 1 time course for each strain.
d, Spo11-oligo labeling to compare DSB levels between wild type and the hop1 red1 double mutant. Flag-tagged Spo11 was immunoprecipitated from denaturing meiotic extracts, then Spo11-oligo complexes were end-labeled with terminal deoxynucleotidyl transferase and [α−32P]-dCTP. Samples were separated on SDS-PAGE and imaged by phosphorimager. Spo11-oligo complexes in yeast run as two prominent bands reflecting different sizes of attached oligos43. Points and error bars represent mean and SD of three independent meiotic cultures. For gel source data, see Supplementary Figure 1.
e, Progression of meiosis in axis mutants. Samples from meiotic cultures were fixed and stained with DAPI, then fractions of cells completing meiosis I (MI) or both MI and meiosis II (MII) were counted. Identical wild-type data are presented in both panels to aid comparison. Points and error bars represent mean and SD of three independent meiotic cultures.
f, Correlation matrix of DSB protein ChIP data sets from wild type and axis mutants. n = 1 time course for each strain.
g, DSB protein distribution relative to open reading frames (ORFs). Using an R package provided by the Hochwagen laboratory17, ORFs were standardized to a length of 1 kb, then ChIP-seq profiles were averaged over the standardized ORFs plus 0.5 kb of upstream and downstream sequence. The 4 h wild-type pattern (light gray shading) is repeated in each panel to facilitate comparison.
h, The centromere effect is retained (albeit spreading less far) in hop1 and red1 single mutants but lost in rec8 mutants. Rec114 ChIP data at 2 h were binned and standardized as in Fig. 2b. The rec8 mutation was epistatic to hop1 red1 for loss of the centromere effect.
i, The per-chromosome duration of DSB protein binding follows an inverse proportion relationship with chromosome size. Duration data from Fig. 1g and Extended Data Fig. 2b were combined, censoring the cold region between CEN3 and MAT.

