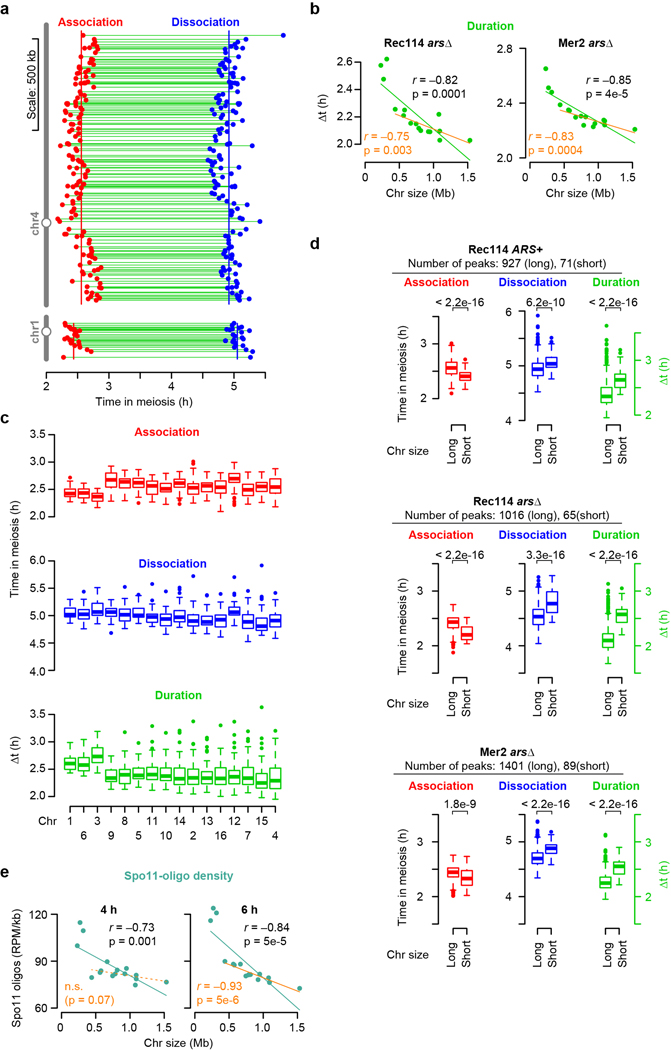
Extended Data Figure 2. Association and dissociation times of DSB protein.
a, Within-chromosome organization of Rec114 association and dissociation times (ARS+ strain). Each point is a called Rec114 peak. Green lines indicate binding duration (Δt). Vertical lines mark the per-chromosome means for association and dissociation.
b, Per-chromosome Rec114 and Mer2 binding duration in arsΔ strains. n = 1 time course for each strain.
c, Association times, dissociation times, and binding duration of Rec114 (ARS+ strain) at Rec114 peaks, broken down by chromosome. n = 998 Rec114 peaks. In all boxplots in this study: thick horizontal bars are medians, box edges are upper and lower quartiles, whiskers indicate values within 1.5 fold of interquartile range, and points are outliers.
d, Rec114/Mer2 shows early association and late dissociation on short chromosomes and thus longer duration of binding. Values were grouped for the shortest three chromosomes and the other thirteen chromosomes (“long”). Numbers above brackets indicate p values from one-sided Wilcoxon tests.
e, Chromosome size dependency of Spo11-oligo distributions as a function of sampling time. n = 2 time courses.

