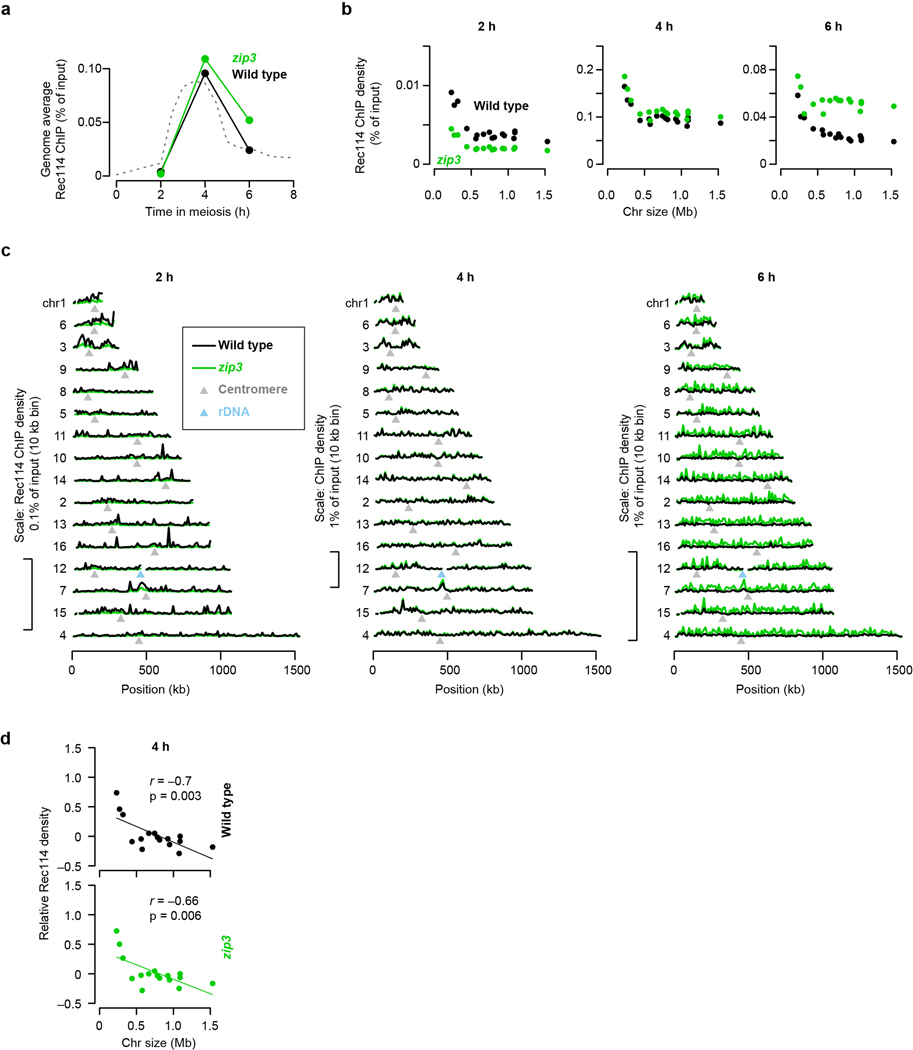
Extended Data Figure 3. Rec114 chromatin binding in the zip3 mutant.
a, Genome-average Rec114 levels. Dashed line represents an independent wild-type profile from Fig. 1d.
b, Effects of zip3 mutation on absolute Rec114 ChIP densities. ChIP-seq coverage was calibrated by qPCR. Each point is the mean for a single chromosome. At 2 h, which is very early in the initial accumulation phase of Rec114 on chromatin, the zip3 mutant has ~;two-fold less Rec114 signal, affecting all chromosomes equivalently. It is possible that this decrease reflects a role for Zip3 early, but since Zip3 is not known to have any function this early in prophase, a more likely explanation is that the zip3 mutant culture lagged slightly behind the wild-type culture. At 4 h, Rec114 ChIP densities were very similar between the cultures, again with little or no difference between chromosomes. However, at 6 h, the zip3 mutant retained substantially more Rec114 signal. At least some of this increase may be attributable to delayed meiotic progression because of inhibition of Ndt807,16, but importantly for purposes of this experiment, the Rec114 levels were disproportionately elevated on the 13 larger chromosomes. n = 1 time course for each strain.
c, Per-chromosome profiles of absolute Rec114 ChIP density.
d, Per-chromosome Rec114 ChIP density. This is the intermediate time point for the samples shown in Fig. 1h.

