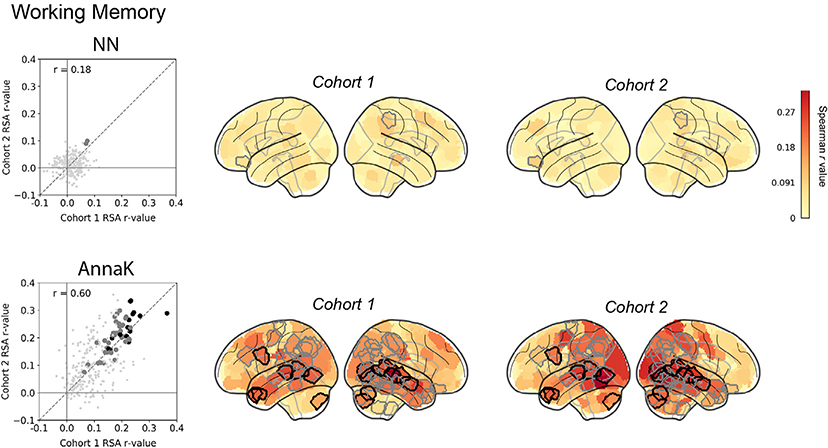
Fig. 3. Inter-subject RSA: Working Memory.
Do pairs of subjects that score more similarly on a test of working memory (Human Connectome Project: ListSort_Unadj) also show stronger ISC in certain brain regions during naturalistic viewing? Two models for behavioral similarity are tested: a nearest-neighbor model (top row; cf.Fig. 2a) where the behavioral similarity matrix is constructed as |i - j|, and an “Anna Karenina “ model (bottom row, cf. Fig. 2b) where the behavioral similarity matrix is constructed as mean(i,j). In the scatter plots, each dot represents one node in the Shen atlas (268 total), plotted according to its representational similarity (Spearman correlation between brain similarity and behavioral similarity matrix, r) in cohort 1 (x- axis) versus its representational similarity in cohort 2 (y-axis). Large gray dots are nodes that show significant representational similarity (p < 0.05, uncorrected) after permutation testing in both cohorts (no. permutations = 10,000 for each cohort); large black dots are nodes that show significant representational similarity (p < 0.0136) after Bonferroni-style correction at α <0.05. The dashed diagonal line represents the identity line y = x (not the regression line), to facilitate visual inspection of replicability—if the results are replicable across cohorts, the RSA r-values should fall close to this line. Glass brains show nodes colored by IS-RSA value. Nodes outlined in gray and black show significant representational similarity after familywise and Bonferroni correction, respectively (corresponding to the large gray and black dots in the scatterplots).

