
FIGURE 1.
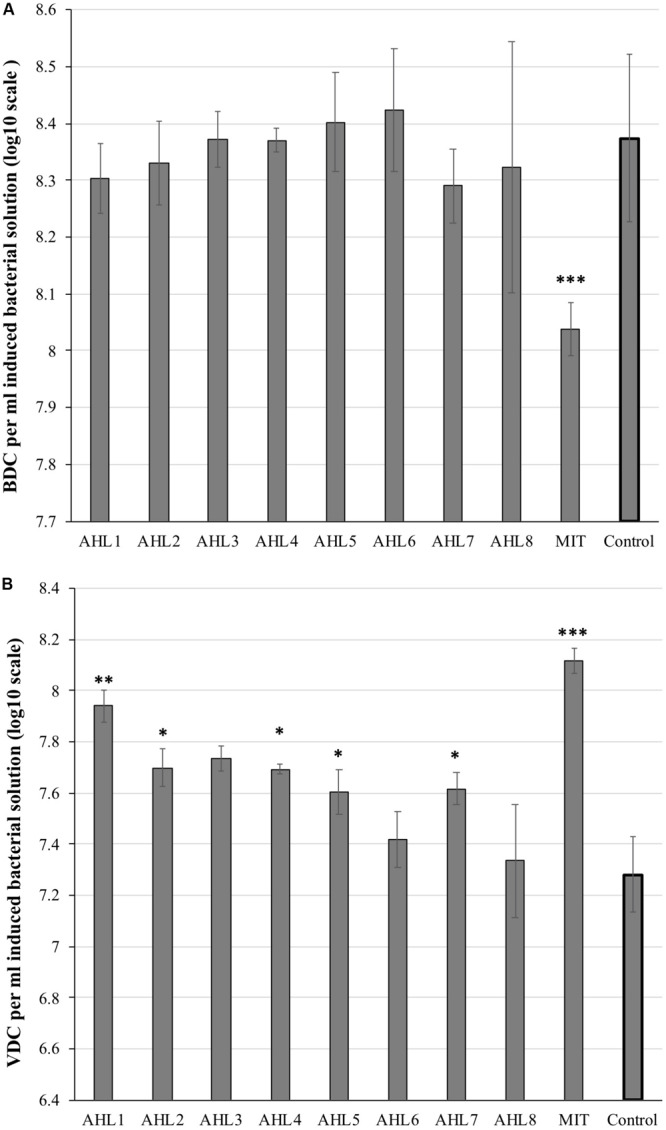
Microscopic direct counts of bacteria (A) and viruses (B) in the induced and control cell suspensions after prophage induction. Inducing agents included mitomycin C (MIT) and N-(Butyryl, Hexanoyl, β-Ketocaproyl, Heptanoyl, Octanoyl, 3-Oxododecanoyl, Tetradecanoyl, and 3-Oxotetradecanoyl) homoserine lactones (represented as AHL1–8). Control indicates unamended control cell suspensions without AHLs or Mitomycin C treatment. Each bar represents the mean of triplicate assays (n = 3), and the error bars show one standard deviation. Statistical significance between the treatment and the control group is indicated by ∗p < 0.05, ∗∗p < 0.01, and ∗∗∗p < 0.001.