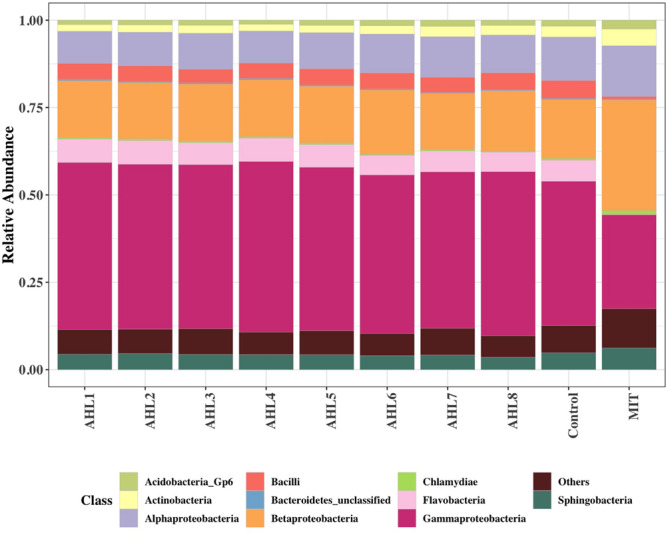
FIGURE 3.

Class-level community composition showing the relative abundances of dominant bacterial classes across all treated samples and the control group. Treatments include induction assays with either N-(Butyryl, Hexanoyl, β-Ketocaproyl, Heptanoyl, Octanoyl, 3-Oxododecanoyl, Tetradecanoyl, and 3-Oxotetradecanoyl) homoserine lactones (represented with AHL1–8, respectively) or mitomycin C (MIT).
