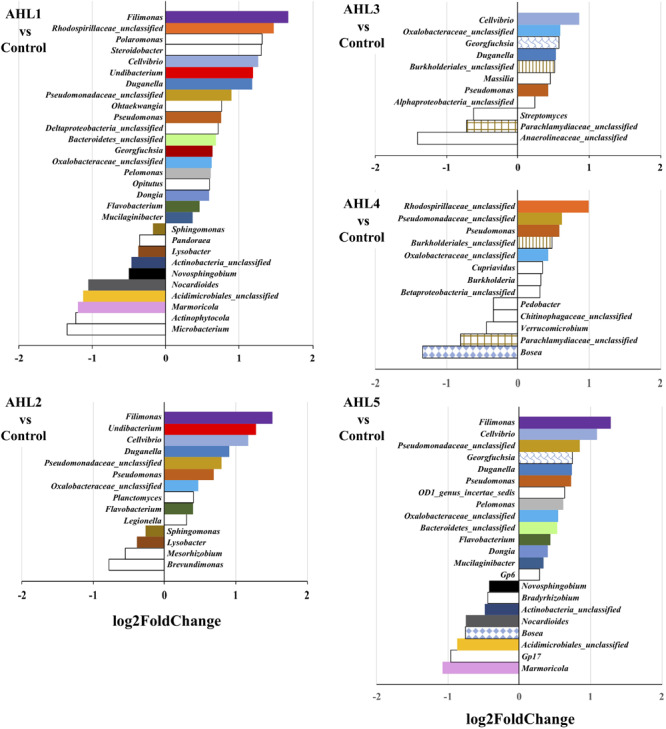
FIGURE 4.

Genus-level differences of the bacterial community composition between each induction assay of N-(Butyryl, Hexanoyl, β-Ketocaproyl, Heptanoyl, Octanoyl, 3-Oxododecanoyl, Tetradecanoyl, and 3-Oxotetradecanoyl) homoserine lactones (indicated by AHL1–8, respectively) and the control suspensions. Only statistically significant differences (P < 0.01) were shown. The direction of bars represents decreases (left) or increases (right) in relative abundance of the specific bacterial taxonomic group after the induction assays relative to the unamended controls. Differential analysis of bacterial taxonomic abundances between the treatment and control group was performed using the DESeq2 package for R (Love et al., 2014). Variance mean was estimated over all treatments (each was based on three replicate assays and treated independently and identically). The color of the bar represents taxonomic group shared by two or more different treatments, and the bars without fill represent the taxonomic groups with significant differences compared with the control only detected in the current treatment.
