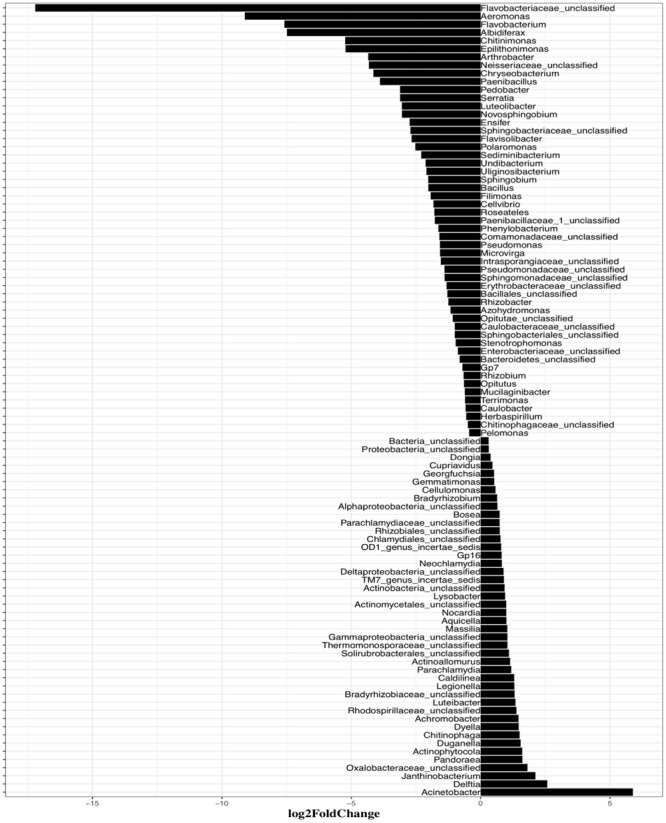
FIGURE 5.

Systematic differences of the bacterial taxonomic composition between induction assay of mitomycin C and the control samples at Genus levels. Only statistically significant differences (P < 0.01) are shown. The direction of bars represents decreases (left) or increases (right) in relative abundance of the specific bacterial taxonomic groups after the induction assays.
