Figure 2.

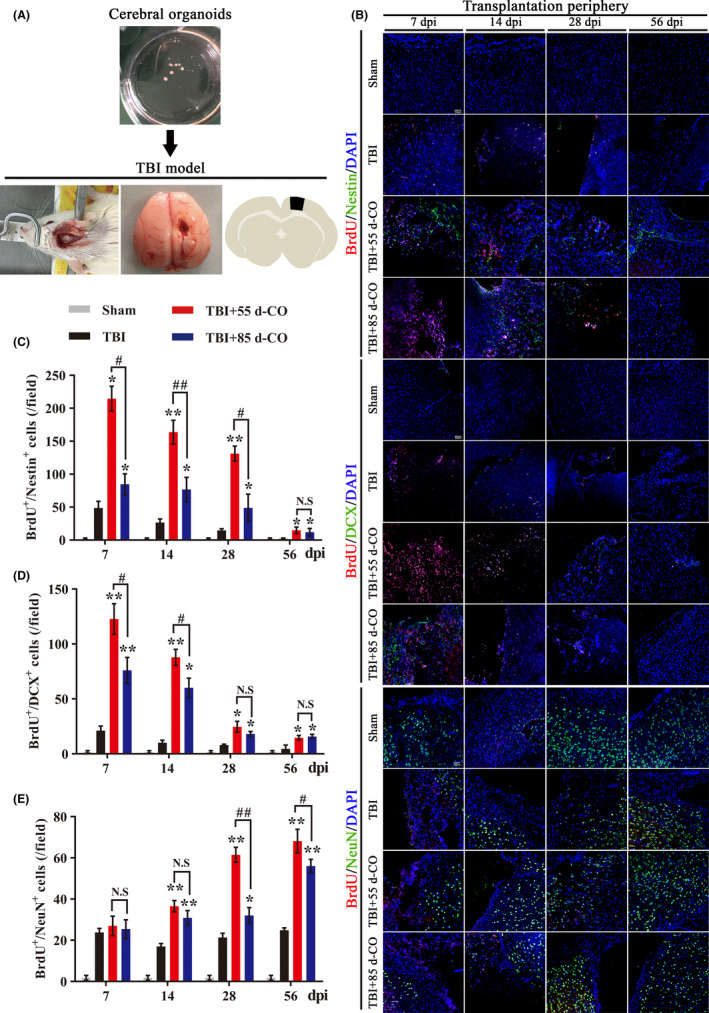
More neurogenesis in 55 d‐CO than 85 d‐CO transplantation periphery of ipsilateral cortex in rat TBI model. A, Illustration of COs transplantation into damaged motor cortex in the rat TBI model. The lesioned cavity was made at the motor cortex (1.5 mm lateral to midline, 0.5 mm posterior to bregma) by biopsy punch. B, Representative images of neurogenesis in the transplantation periphery of ipsilateral cortex by immunostaining of proliferated neural stem cells (BrdU+/Nestin+, red and green, respectively), migrated newborn neurons (BrdU+/DCX+, red and green, respectively), and differentiated mature neurons (BrdU+/NeuN+, red and green, respectively) at 7, 14, 28, and 56 dpi in Sham, TBI, 55 d‐CO transplantation, and 85 d‐CO transplantation groups. BrdU, proliferation marker. DAPI labels nuclei (blue). Scale bars: 50 μm. C‐E, Quantitative analysis of neurogenesis by counting BrdU+/Nestin+, BrdU+/DCX+, and BrdU+/NeuN+ cells in the transplantation periphery of ipsilateral cortex at 7, 14, 28, and 56 dpi. Immuno‐stained positive cells were counted with six random microscope fields in the transplantation periphery of ipsilateral cortex, and repeated with at least three independent animals per group. All data were shown as mean ± SEM and analyzed by ANOVA with Bonferroni posthoc tests. *P < .05, **P < .01 vs TBI group; #P < .05, ##P < .01. N.S, not significant
