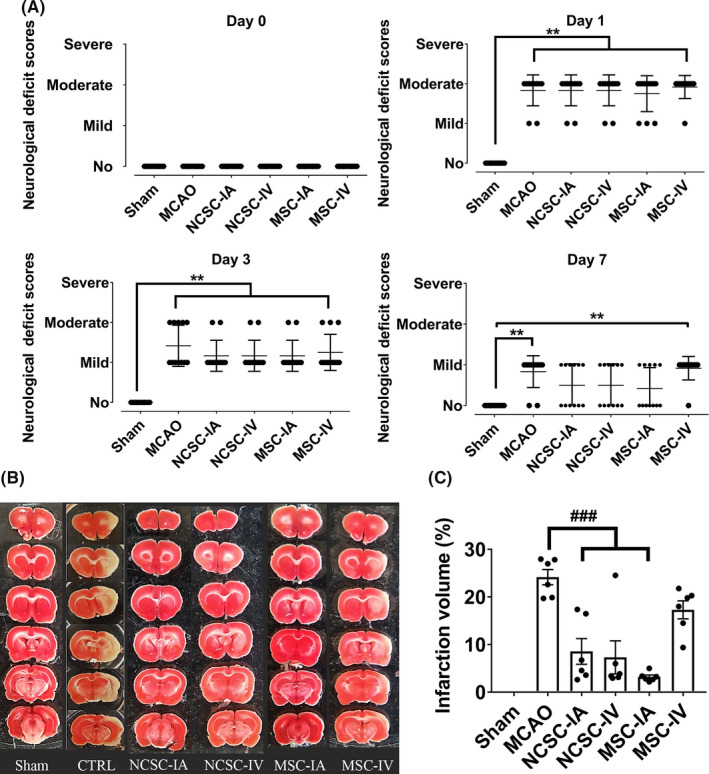
FIGURE 2.

A, Neurological deficit before surgeries (day 0) and 1, 3, and 7 d postischemia/cell therapy. ** P < .01 (n = 12 in each experimental group); B, Representative photographs of coronal brain sections 7 days postischemia/cell therapy in six experimental groups stained with 2,3,5‐triphenyltetrazolium chloride and C, Bar graph showing %infarct volumes in each group. ### P < .001 (only significant differences compared to MCAO group are pointed; n = 6 in each experimental group)
