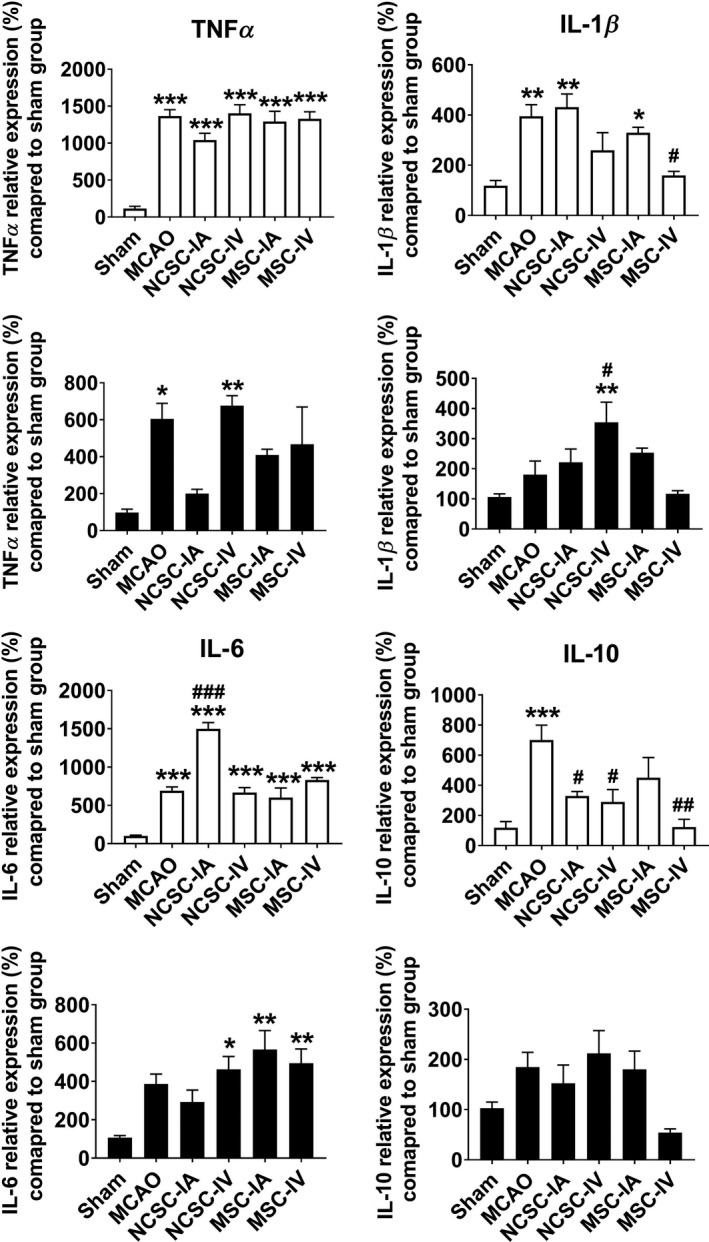
FIGURE 5.

Relative expression of tumor necrosis factor‐α (TNFα), interleukin (IL)‐1β, IL‐6, and IL‐10 7 d postischemia/cell therapy in the striatum as well as cortex of six experimental groups. * P < .05, ** P < .01, *** P < .001 significant differences compared to sham group; # P < .05, ## P < .01, ### P < .001 significant differences compared to MCAO group (n = 6 in each experimental group)
