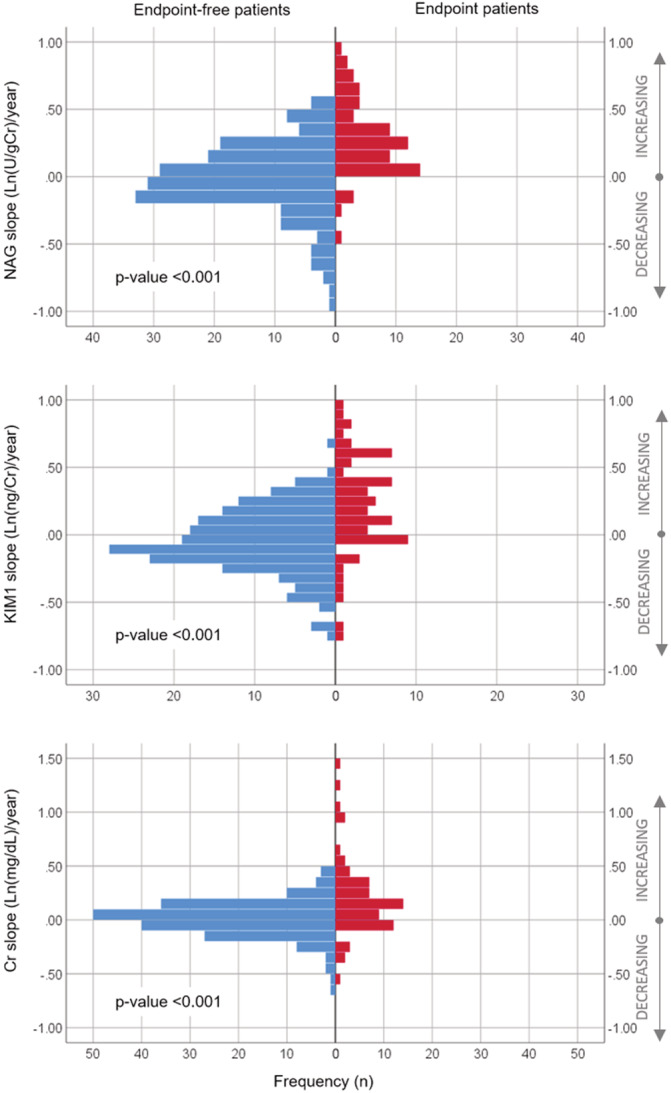
Figure 1.

Distributions of slopes of renal biomarkers prior to study endpoints. Notes: X‐axis displays number of patients who experienced the event (red) and those who did not (blue), Y‐axis displays the estimated slopes on the continuous scale, where positive numbers correspond to increasing slopes and negative numbers correspond to decreasing slopes. t test was used test the average difference between patient with and without event
