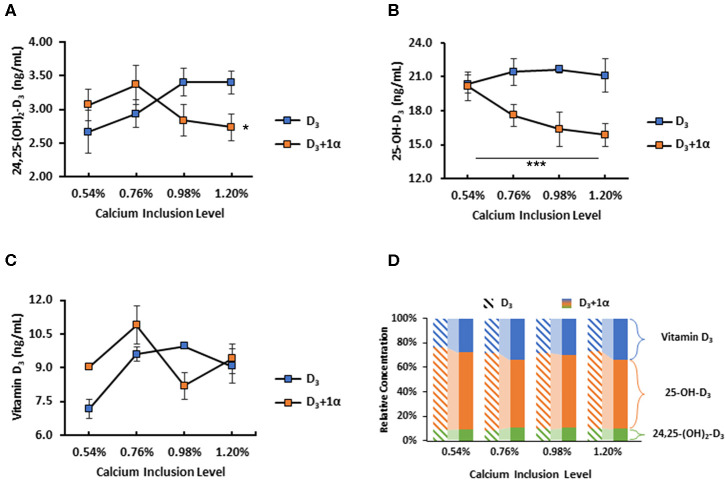
Figure 4.
Vitamin D metabolite plasma concentrations of 35 d broiler chickens fed different levels of calcium with or without 1-alpha-hydroxycholecalciferol supplementation (D3 + 1α;D3, respectively). (A) 24,25-dihydroxycholecalciferol (24,25-(OH)2-D3) (B) 25-hydroxycholecalciferol (25-OH-D3) (C) Cholecalciferol (Vitamin D3) (D) Comparison of relative concentration between each vitamin D3 metabolite between D3 and D3 + 1α groups; diagonal patterned bars denote D3 and solid bars denote D3 + 1α. 1α supplementation effect with 25-OH-D3. Interaction between calcium inclusion and 1α supplementation with plasma vitamin D3. Line graphs show means ± standard error means [n = 3; General linear models (GLM), *p < 0.05; ***p ≤ 0.0001].

