FIGURE 2.
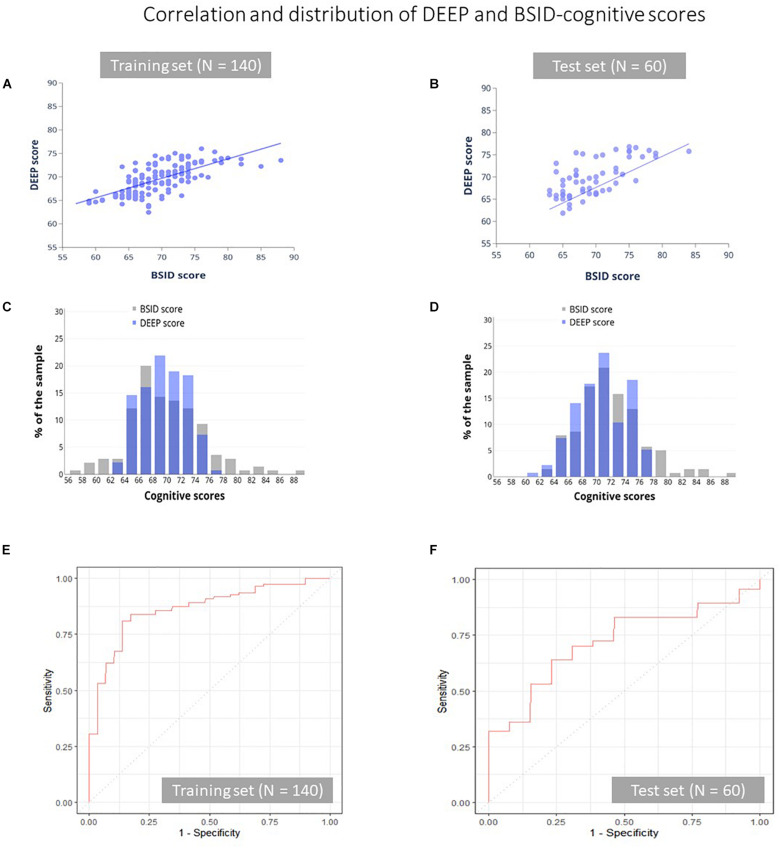
Correlation and distribution of DEEP and BSID-cognitive scores. The correlation between DEEP and BSID-cognitive scores (A,B), their distribution (C,D) and the ROC curves of the training (E) and test (F) datasets is shown. Gray and purple bars represent the BSID-cognitive and DEEP scores respectively.

