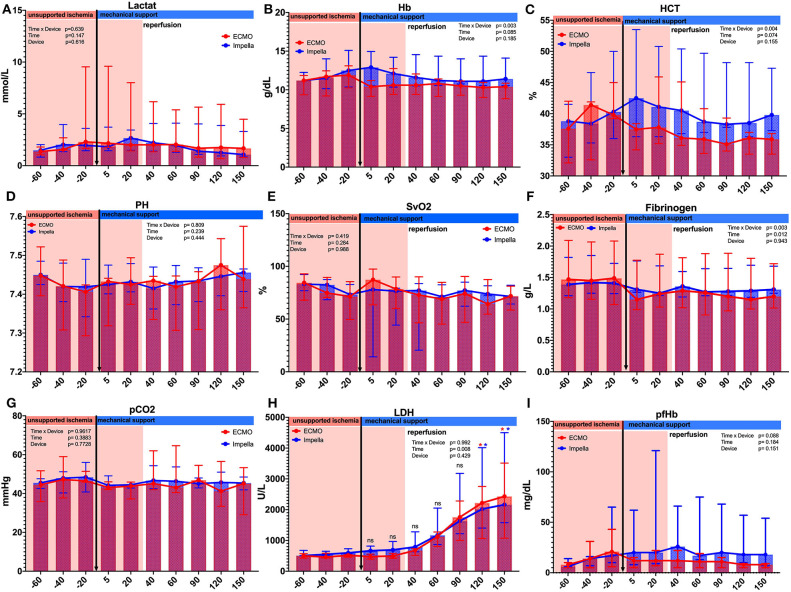
Figure 2.
Comparison of laboratory parameter between and within the groups. Several laboratory parameters were captured during the experiment. (A) Lactate; (B) Hemoglobin g/dL;(C) Hematocrit %; (D) PH values; (E) Central venous saturation %; (F) Fibrinogen g/L; (G) Partial CO2 pressure mmHg; (H) Lactate dehydrogenase U/L; (I) Plasma free hemoglobin. Asterisks: *p < 0.05, black Asterisks indicates significance between the groups; blue Asterisks indicate significance within the Impella group compared to the time point t = −20; red Asterisks indicate significance within the ECMO group compared to the time point t = −20.

