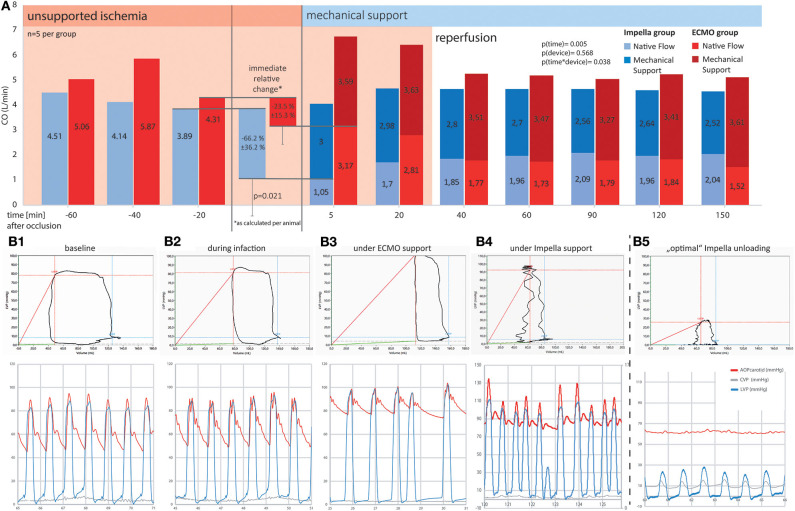
Figure 3.
Comparison of cardiac output and pressure-volume loops between ECMO and Impella groups. Mechanical support is emphasized, showing a significantly more prominent reduction in native flow at the onset of Impella support as compared to ECMO. Ten minutes into the onset of reperfusion (t = 40 min and after), both systems were able to maintain a physiologic total (as the sum of native and device) output by providing between 2.5 and 3.5 L/min additional flow to the blood circuit. (A) Systemic flow as SV*HR (native equivalent) device flow over time (A) and as percentage of change on onset of device support; (B) Exemplary pressure-volume loops and corresponding pressure tracings for different timepoints in the experiment. (B1) Shows a baseline recording in a healthy animal. During myocardial infarction (B2), the decrease in contractility leads to a reduction in left ventricular ejection fraction, the difference between diastolic and systolic LV volume decreases. ECMO (B3) is able to restore perfusion pressure but further diminishes ejection fraction. Without active unloading, the PV curve is right shifted to supra-normal volumes. (B4,B5) represent two different support situations under Impella treatment. While (B4) already shows a left shift of the PV loop, indicating ventricular volume unloading, the ventricle is still able to generate pressure and thus to contribute actively to blood expulsion in systole. (B5) Additionally shows uncoupling of the ventricular (blue) from the aortic pressure wave (red). This “optimal” unloading further minimizes the PV-area and thus the myocardial energy consumption as the myocardium is no longer actively contributing to blood flow. Especially in an unloaded (i.e., emptied) ventricle, co-location of the PV-catheter and the Impella pump causes signal interferences as demonstrated by the unstable lines in the PV-loop section of B4/5. Behold that while both devices reduce active ventricular ejection when supporting circulation, ECMO leads to a right shift and thus increases LV wall stress, whereas Impella left shifts the PV loop, thus reducing myocardial workload. For better visualization, in the lower graphs, arterial (red) and left ventricular (blue) pressure curves have been superimposed. Due to the distance in measurement, arterial signals are usually delayed by a notable offset.

