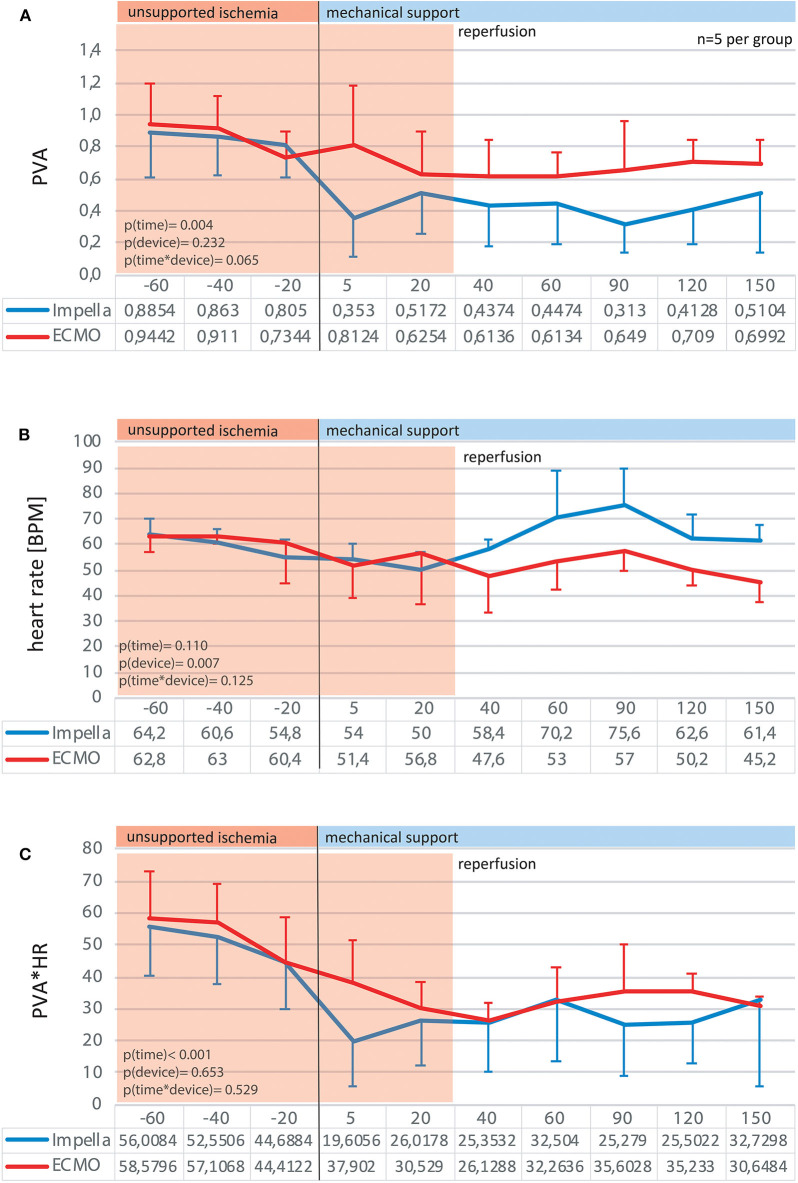
Figure 6.
Myocardial energy consumption estimates. By analysis of the pressure-volume diagrams at given time point, the pressure-volume areas were traced as an estimate for myocardial work per beat (A). Together with the heart rate (B) the product of pressure-volume area*heart rate can be used as a valid estimate for myocardial work-load over time (C).

