FIGURE 3.

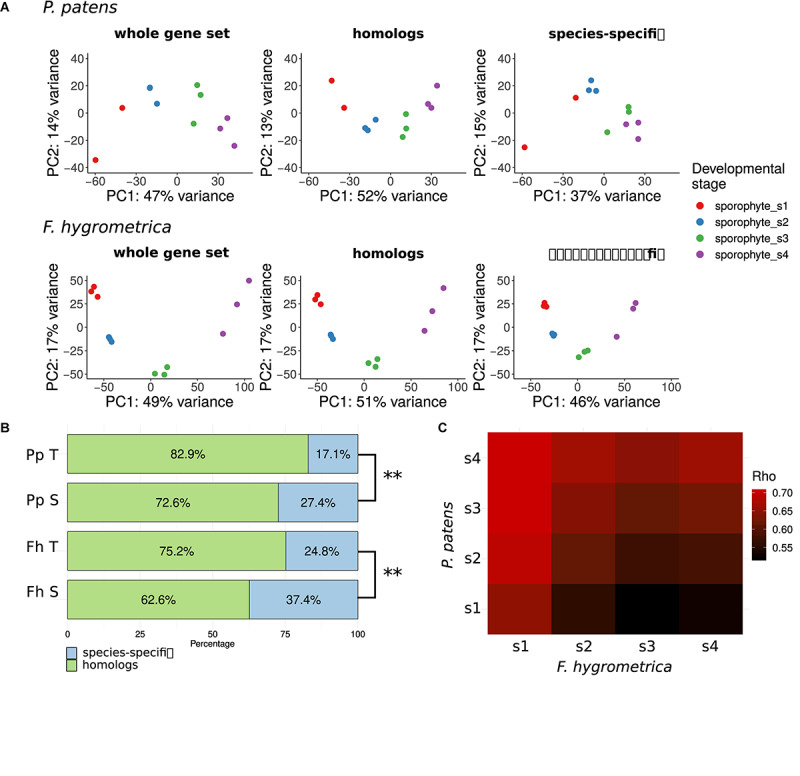
Gene expression variation throughout the sporophyte development of Funaria hygrometrica and Physcomitrium patens. (A) Principal component analysis (PCA) of gene expression variation during sporophyte development in P. patens and F. hygrometrica. PCA was carried out by using gene expression data for all expressed genes (“whole gene set”), for homologous genes (“homologs”), and for species-specific genes (“species-specific”). (B) Proportion of homologous and species-specific genes in the transcriptome data sets of F. hygrometrica (Fh) and P. patens (Pp). For each species the total set of transcripts detected in the gametophyte and sporophyte phases (Pp T, Fh T) and the set of transcripts that is specifically expressed in the sporophyte phase (Pp S, Fh S; log2 fold change ≥ 2, q ≤ 0.05) is shown. ∗∗ marks significant dependence of distribution between homologs and species-specific genes on the considered subset according to Chi-squared test (p ≤ 0.01). (C) Correlation coefficients (Spearman’s Rho) of gene expression between developmental stages 1 to 4 of P. patens and F. hygrometrica sporophytes. Only one-to-one orthologs for which expression was observed in both samples were used to calculate the corresponding rank correlation. Spearman’s Rho was calculated using normalized and log-transformed raw count values.
