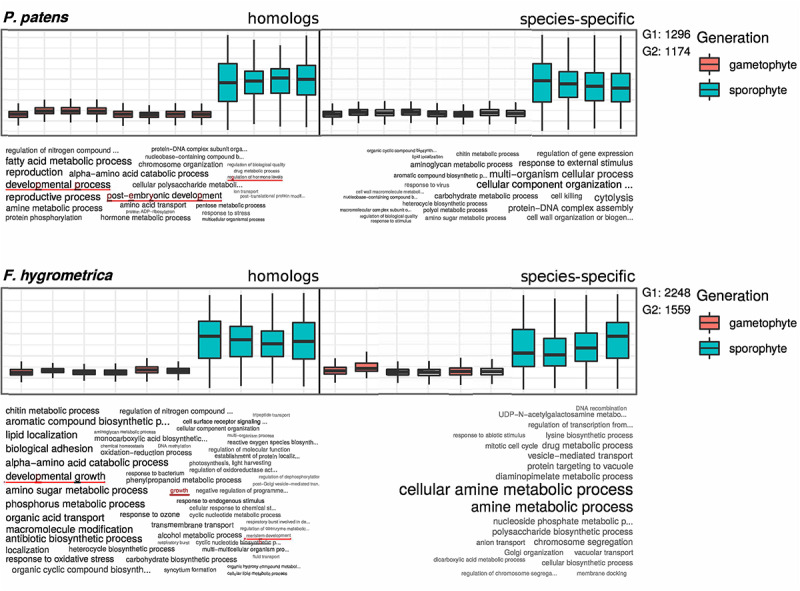
FIGURE 4.

GO term enrichment analysis of preferentially sporophyte expressed genes in Physcomitrium patens and Funaria hygrometrica. Upper panels show standardized expression values of the respective subset of genes. Homologous genes are shown on the left side and species-specific genes on the right side of the plots. Lower panels show a visualization of enriched GO terms in the respective subsets, word size is correlated with the significance value obtained from the enrichment analysis. G1 and G2 denote the number of genes in the subsets of homologous (G1) and species-specific (G2) genes, used in the enrichment analysis. GO terms potentially connected to differential sporophyte development in the two species are underlined (see red lines).
