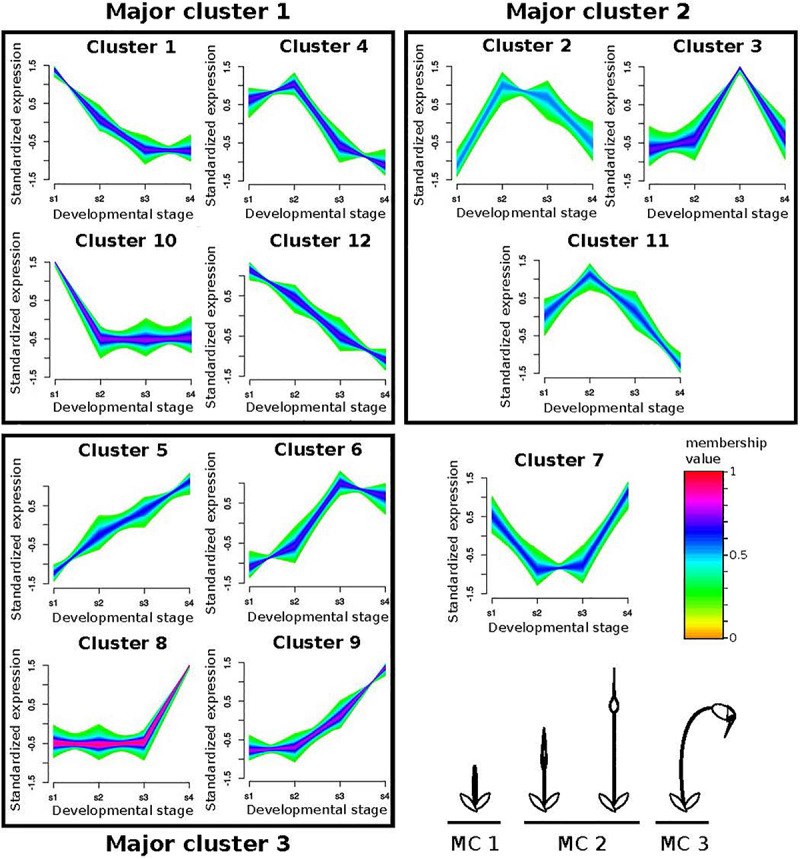
FIGURE 5.

Fuzzy clustering of gene expression data from 4 stages of sporophyte development of Funaria hygrometrica and Physcomitrium patens. We identified 12 clusters with distinct expression profiles. For each cluster, relative expression changes of the assigned genes are shown together with their color-coded membership values, indicating how strong their expression pattern correlates with the cluster core. The clusters are further condensed to Major clusters (MC), depending on whether expression peaks occurred during early (MC 1), intermediate (MC 2), or late (MC 3) sporophyte development (bottom right). Cluster 7 could not be assigned to one of the major clusters. s1 – s4: sporophyte developmental stages 1 to 4.
