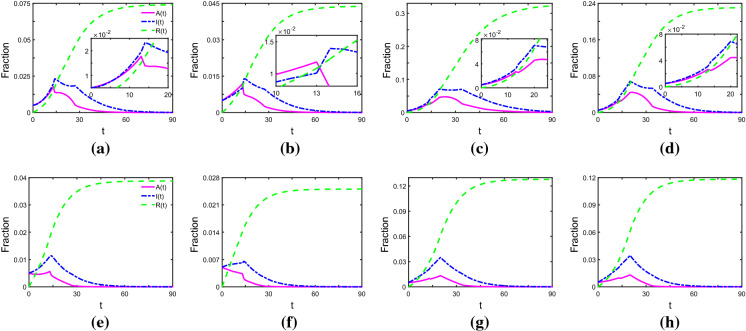
Fig. 2.
Time evolution of A(t), I(t) and R(t), where , and . In the top panels, and , and in the bottom panels, and . a, e Measure 1 is taken immediately at ; b, f Measures 1 and 2 are taken from ; c, g Measure 1 comes into force at ; d, h two measures come into force at . We set that nodes with degree of over 10 are hub nodes. The pink solid line, blue dotted-dashed line and green dashed line represent the fraction of asymptomatically infected, symptomatically infected and removed individuals, respectively

