
Figure 4.
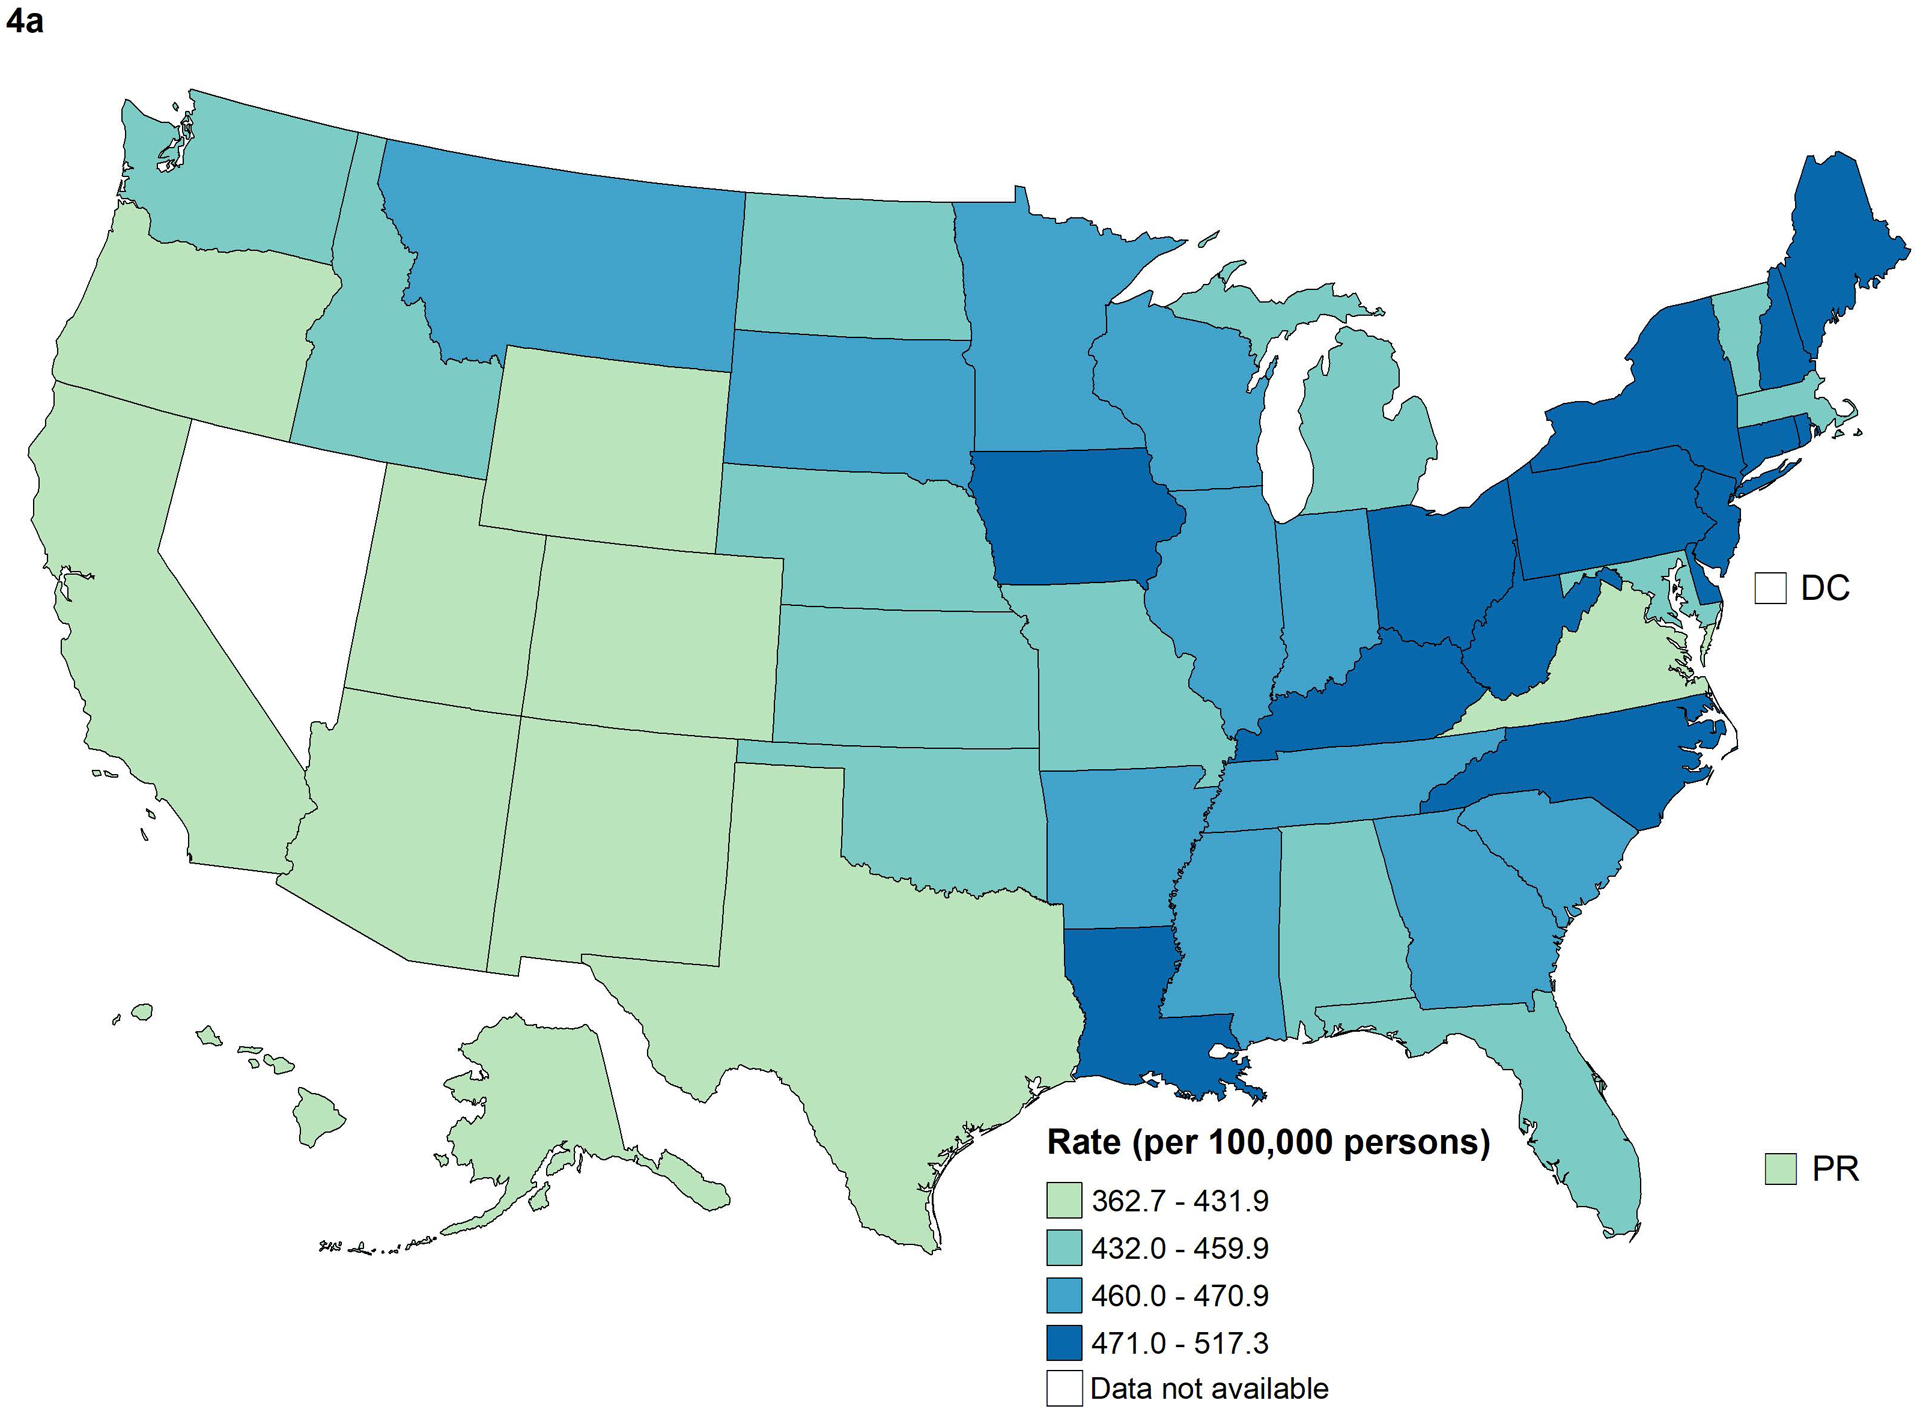
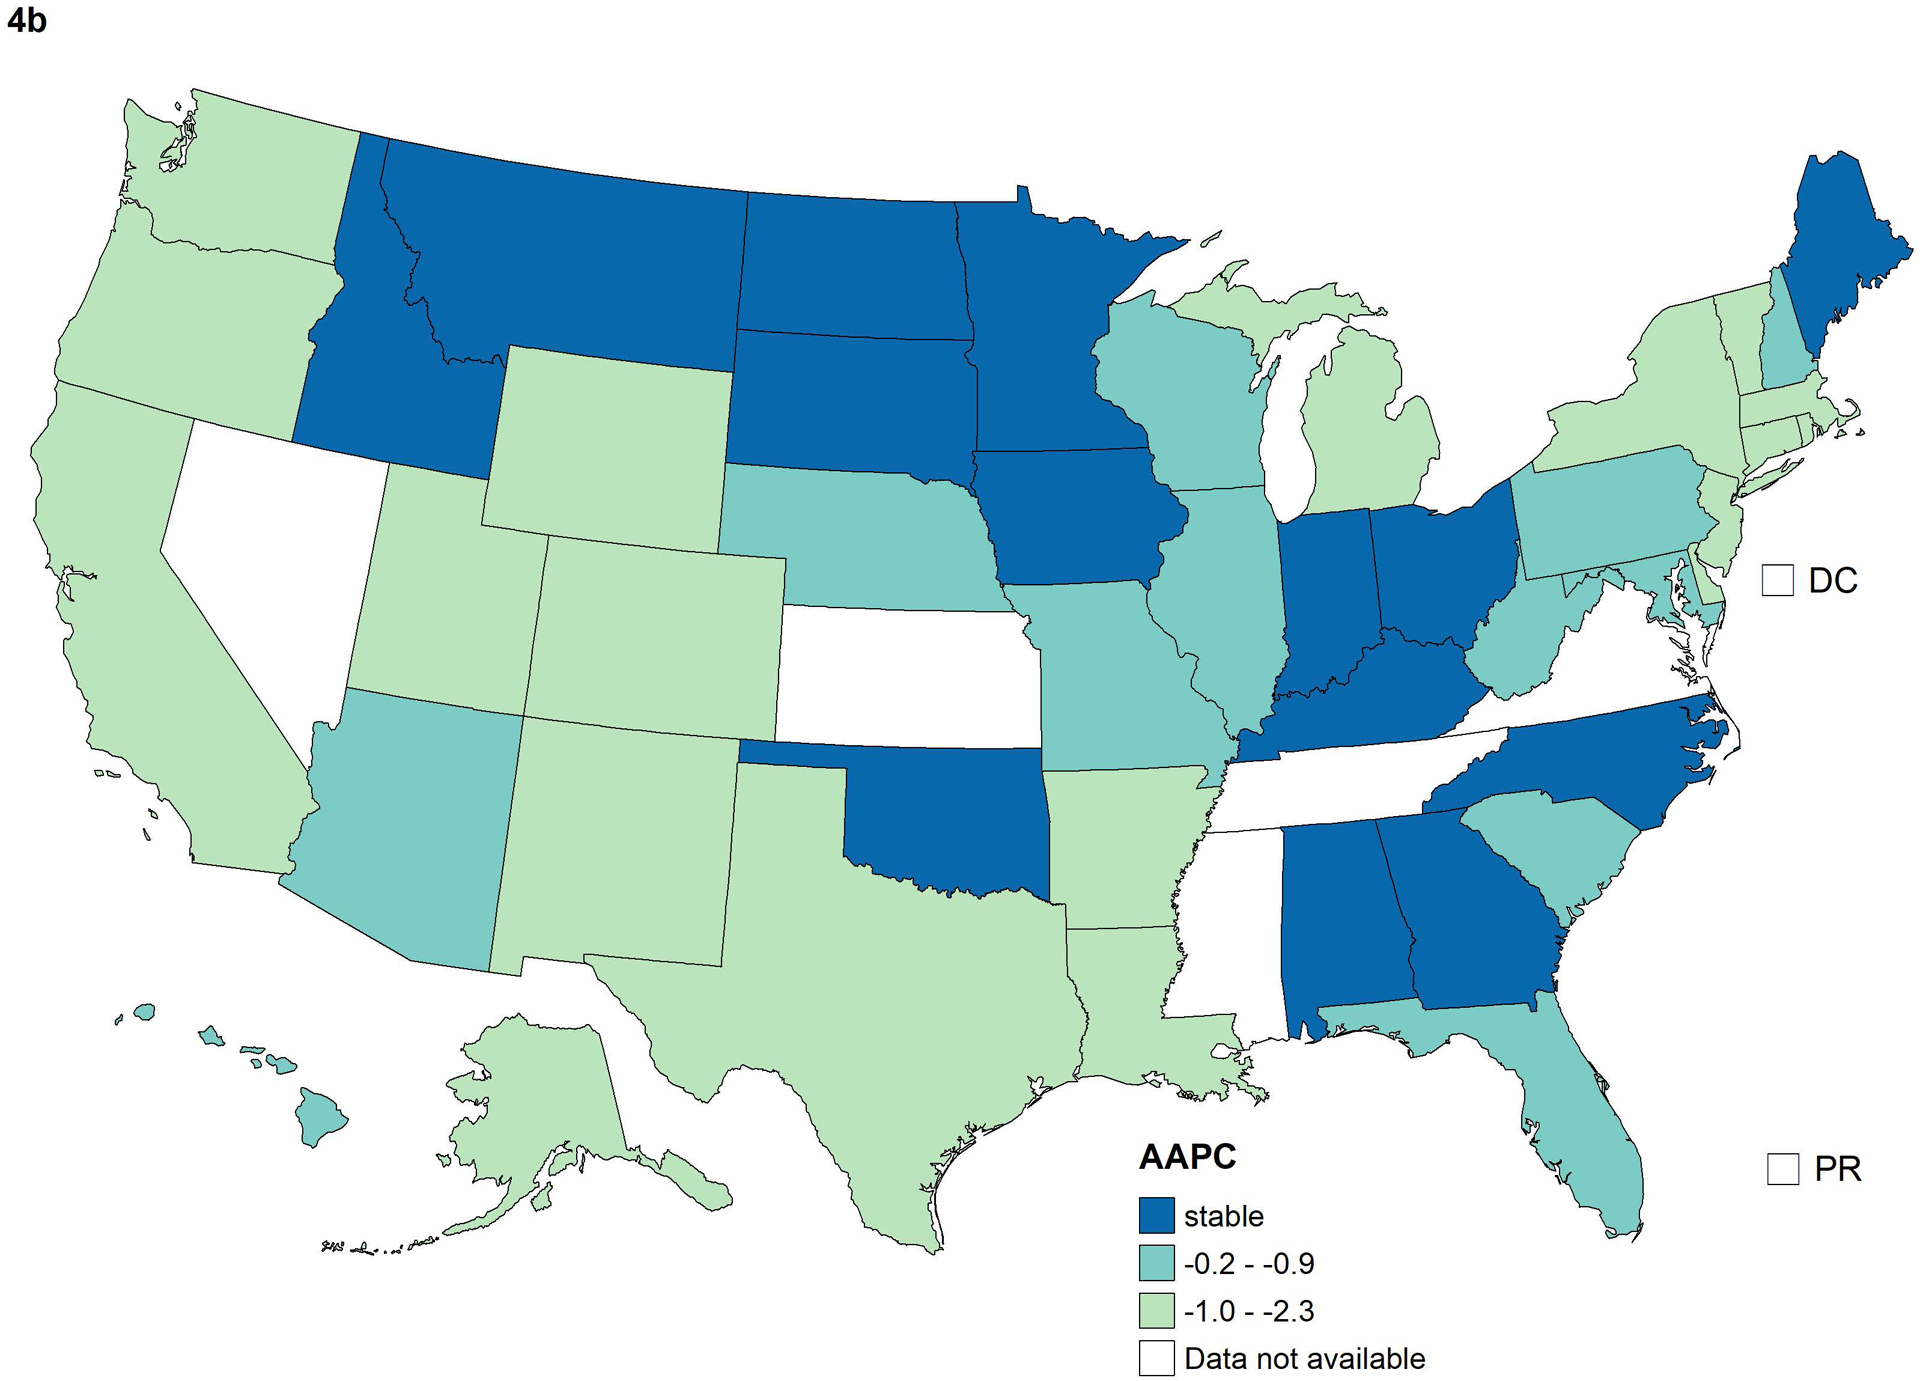
Age-standardized, delay-adjusted overall cancer incidence rates for 2012–2016 (A) and average annual percent change (AAPC) in rates for 2012–2016 (B) by state. The AAPC was a weighted average of the annual percent change (APCs) over the fixed 5-year interval 2012–2016 using the underlying joinpoint regression model, which allowed up to 3 different APCs, for the 16-year period 2001–2016. Stable AAPCs were not statistically significantly different from zero (P<0.05).