
Fig. 5 |. Epigenomic regulators of T cell exhaustion after PD-1 blockade.
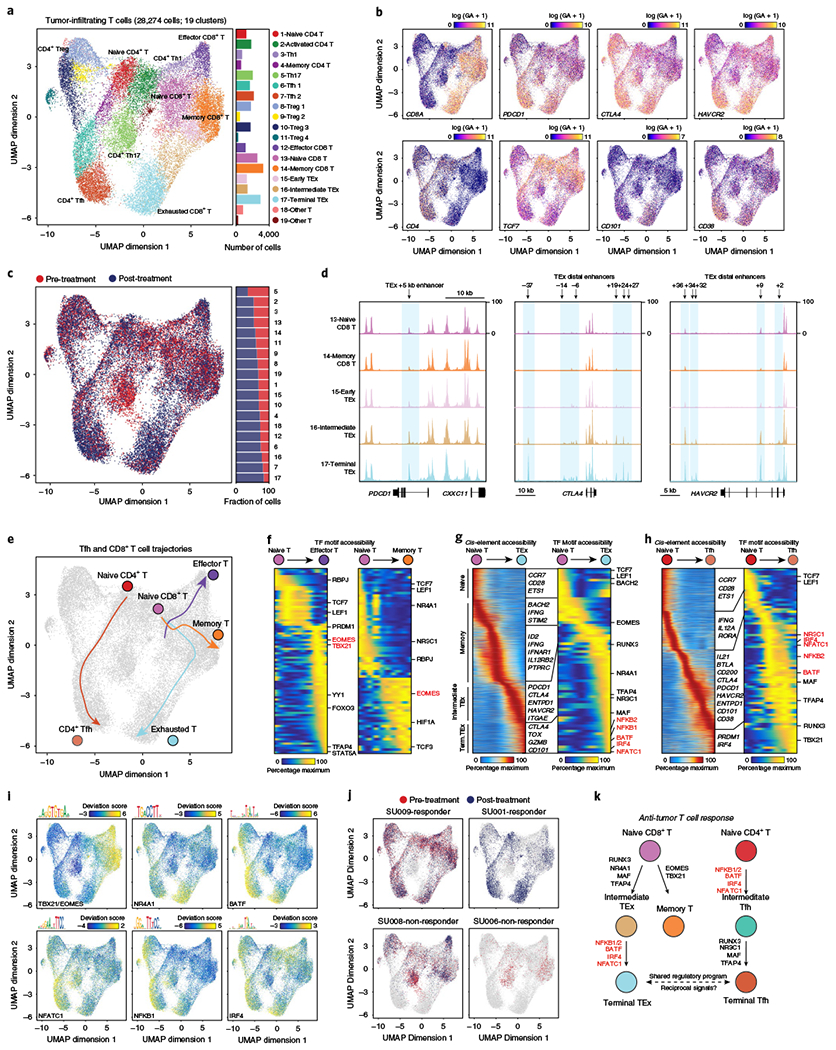
a, Subclustering UMAP projection of 28,274 tumor-infiltrating T cells (clusters 1–9 from TME UMAP). scATAC-seq profiles are colored by cluster identity, as labeled on the right. For CD8+ T cells, naïve T cells showed high CCR7 and TCF7 gene scores; effector T cells: high EOMES and IFNG gene scores; memory T cells: high EOMES gene score, but low effector gene scores; and exhausted T cells: high gene scores for inhibitory receptors PDCD1, CTLA4 and HAVCR2, and T cell dysfunction genes, CD101 and CD38. For CD4+ T cells, Tregs showed high FOXP3 and CTLA4 gene scores; Th1 cells: high IFNG and TBX21 gene scores; Th17 cells: high IL17A and CTSH gene scores; and Tfh cells: high CXCR5, IL21 and BTLA gene scores. Bar plot indicates the number of cells in each cluster of cells. b, UMAP projection colored by log-normalized gene scores demonstrating the accessibility of cis-regulatory elements linked (using Cicero) to the indicated gene. c, UMAP projection of tumor-infiltrating T cells colored by pre- and post-PD-1 blockade samples. d, Genome tracks of aggregate scATAC-seq data, clustered as indicated in a. Arrows indicate the position and distance (in kb) of intragenic or distal enhancers in each gene locus. e, Lineage trajectories of Tfh and CD8+ T cell states. Lines represent double-spline fitted trajectories across pseudotime. f, Pseudotime heatmap ordering of chromVAR TF motif bias-corrected deviations in effector and memory CD8+ T lineage trajectory. TF motifs are filtered for genes that are highly active (defined as the average percentile between total TF activity and variability > 0.75) that also demonstrate similarly dynamic gene scores across differentiation (R > 0.35 and FDR < 0.001 across 1,000 incremental groups). Heatmap of TF gene scores is shown on the right. g, Pseudotime heatmap ordering of cis-regulatory elements (left) and chromVAR TF motif bias-corrected deviations (right) in the CD8+ TEx lineage trajectory. h, Pseudotime heatmap ordering of cis-regulatory elements (left) and chromVAR TF motif bias-corrected deviations (right) in the CD4+ Tfh lineage trajectory. i, UMAP projection of scATAC-seq profiles colored by chromVAR TF motif bias-corrected deviations for the indicated factors. j, UMAP projection of tumor-infiltrating T cells colored by pre- and post-PD-1 in representative individual responder and nonresponder patients. k, Schematic of regulatory modules controlling TEx and Tfh differentiation.