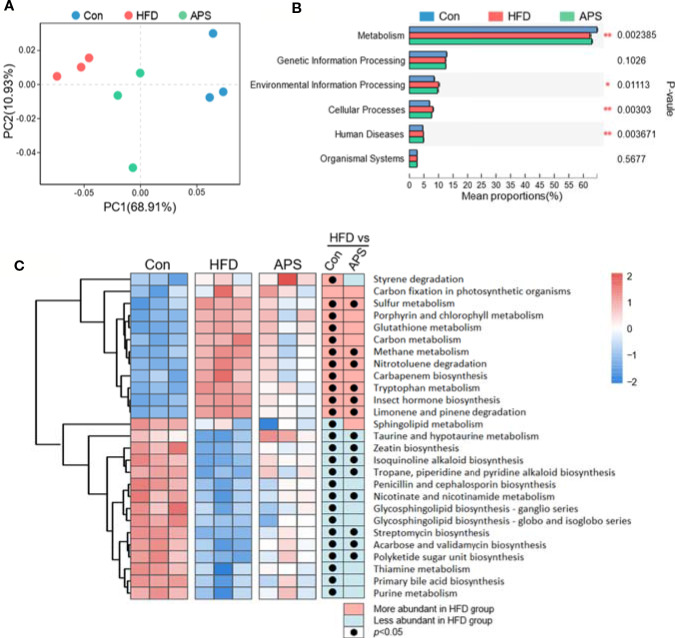
Figure 3.
APS regulates gut microbial function in HFD-fed mice. (A) Bray_curtis based PCoA analysis in KEGG orthologys (KOs) level followed by Permutational Multivariate Analysis Of Variance (PERMANOVA, R2: 0.745, p-value: 0.002, p.adjust: 0.002). (B) Multigroup difference analysis in KEGG pathway at level 1. *p < 0.05, **p < 0.01. (C) LDA Effect Size (LEfSe) Analysis of gut microbial function at level 3 of metabolism was profiled among three groups. Heatmap of the relative abundances of the metabolic pathways with the criteria of LDA > 2. The black dots mean significant difference (p < 0.05) between HFD and Con groups or between HFD and APS groups.

