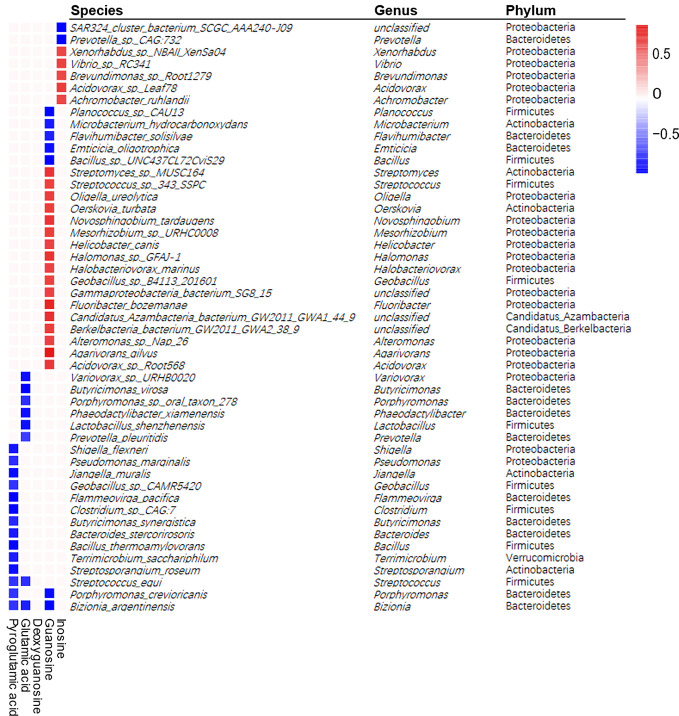
Figure 5.
Spearman correlations between differential metabolites and differential bacterial species. Positive correlations indicated by red cubes and negative correlations indicated by blue cubes. A Spearman's correlation coefficient less than −0.7 or more than 0.7 with p < 0.01 was selected. The selected species were shown with its phylum and genus information.

