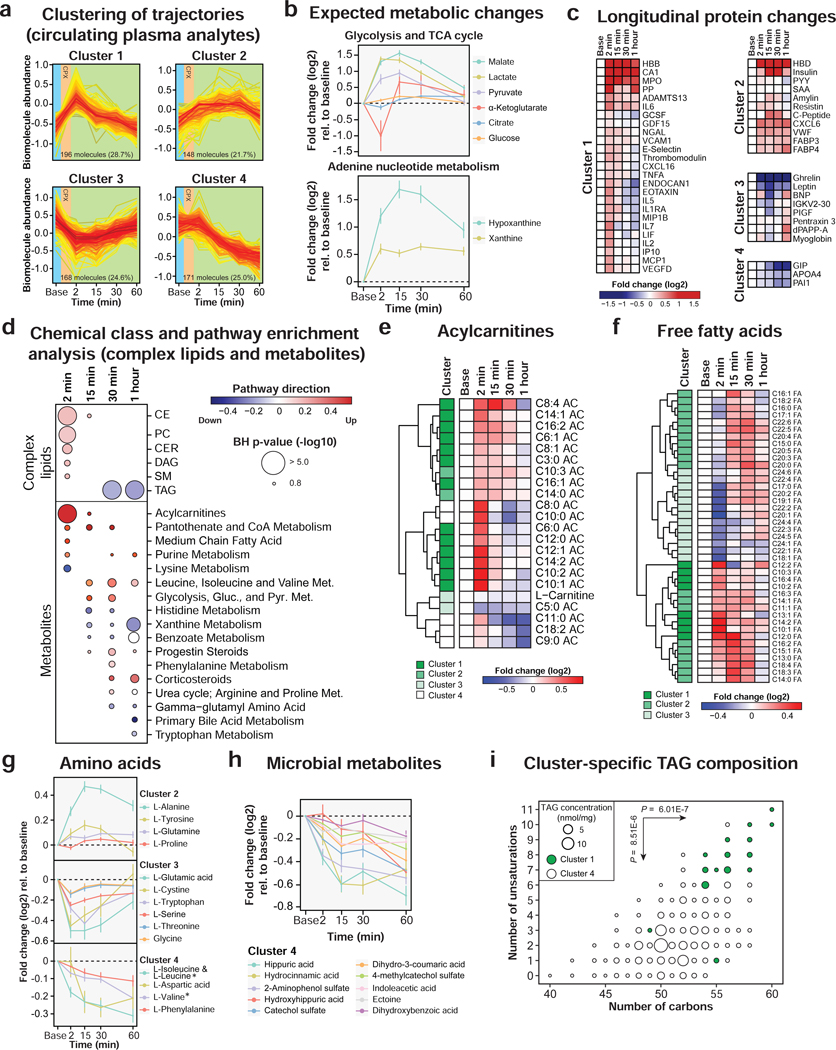
Figure 2. Multi-omic changes in response to acute exercise.
(a) Clustering of longitudinal trajectories using significant circulating plasma analytes (FDR < 0.05). (b) Expected metabolic changes in response to exercise including glycolysis, TCA cycle and adenine nucleotide metabolism. The dots represent the mean log2 fold change relative to baseline and the bars the standard error of the mean (SEM). (c) Heatmap of significant proteins representing the median log2 fold change relative to baseline in the cohort. Proteins were grouped by clusters. (d) Pathway/chemical class enrichment analysis of circulating plasma metabolites and complex lipids. Pathway direction is the median log2 fold change relative to baseline of significant molecules in each pathway (blue: downregulated, red: upregulated). The dot size represents pathway significance. Heatmaps representing the median log2 fold change relative to baseline for acylcarnitines (e) and free fatty acids (f). The clusters are indicated on the left side of the heatmaps. Longitudinal trajectories of significant amino acids (g) and microbial metabolites (h) in response to exercise. The dots represent the mean log2 fold change relative to baseline and the bars the standard error of the mean (SEM). * Branched chain amino acids. (i) Triacylglycerol (TAG) fatty acid composition in clusters 1 and 4. Two-sided Welsh t-tests were used to calculate differential enrichment in TAG composition. See also Figures S4–S5 and Table S2.

