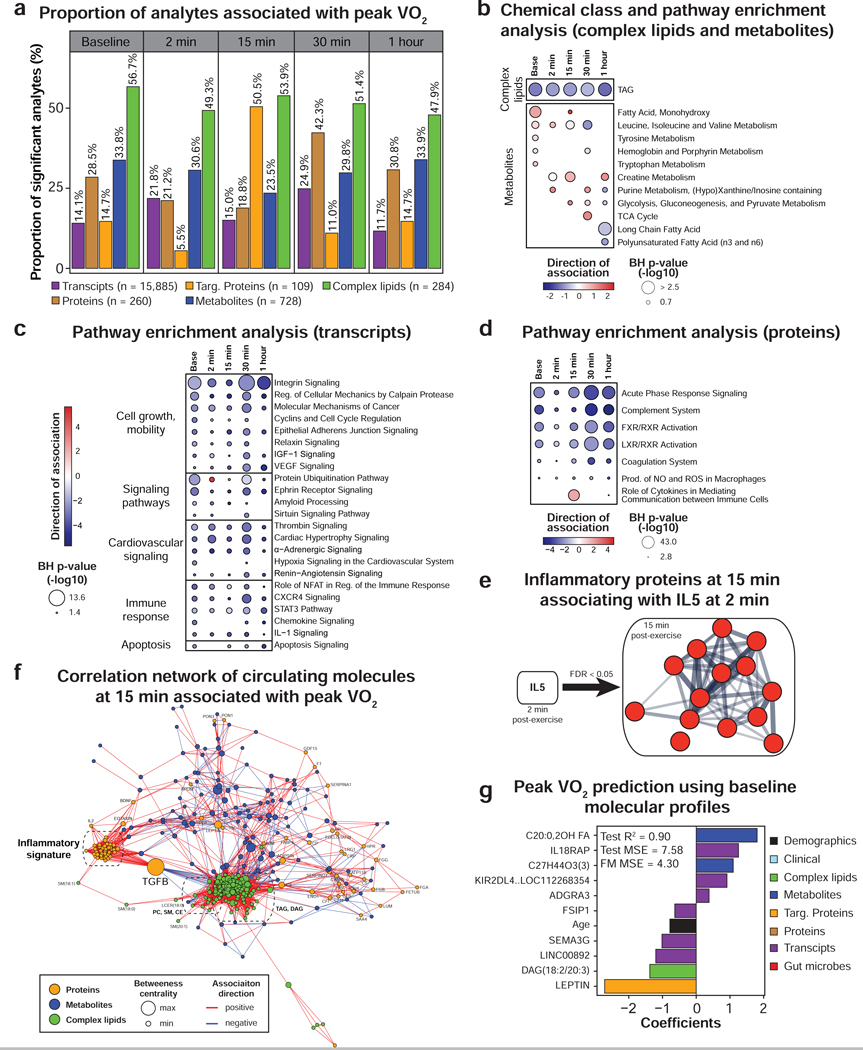
Figure 5. Multi-omic analysis of peak VO2.
(a) Proportion of analytes associated with peak VO2 (scaled by body weight) as determined by linear regression analysis. Only the molecules significant in three regression models adjusting for BMI or fat mass or percent fat were presented. Pathway/chemical class enrichment analysis of metabolites and complex lipids (b) as well as pathway analysis using PBMC gene expression (c) and circulating proteins (d). Pathway direction is the median beta coefficient of significant molecules in the pathway (blue: negative association, red: positive association). The dot size represents pathway significance. (e) Functional association network using the proteins from the “inflammatory fitness signature” at 15 min in recovery significantly associated with IL-5 at 2 min post-exercise (spearman correlation, FDR < 0.05). This analysis was performed using the web tool STRING. Line thickness indicates the strength of data support. Proteins are colored in red to signify a positive association with IL-5. (f) Pairwise spearman correlation networks of multi-omic measures significantly associated with peak VO2 at 15 min post-exercise. Nodes were color-coded by molecule type, their size represent the betweenness centrality and the edges were color-coded by association direction. (g) Molecules selected in the multi-omic peak VO2 prediction model and associated coefficients. MSE: mean square error, FM: full model. See also Figure S6 and Table S4.

