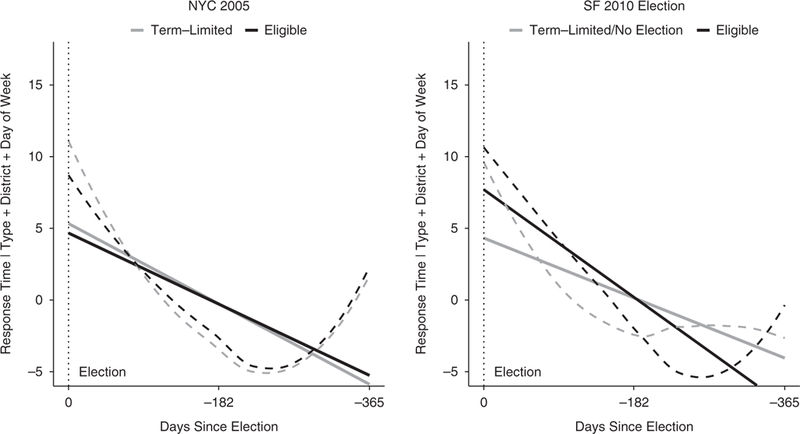
Figure 3. Response times by treatment status after the election.

Note: After the election, response times do not fall faster in the districts of previously eligible councilors. Solid lines are linear trends; dashed lines are loess smoothers. NYC = New York City; SF = San Francisco.
