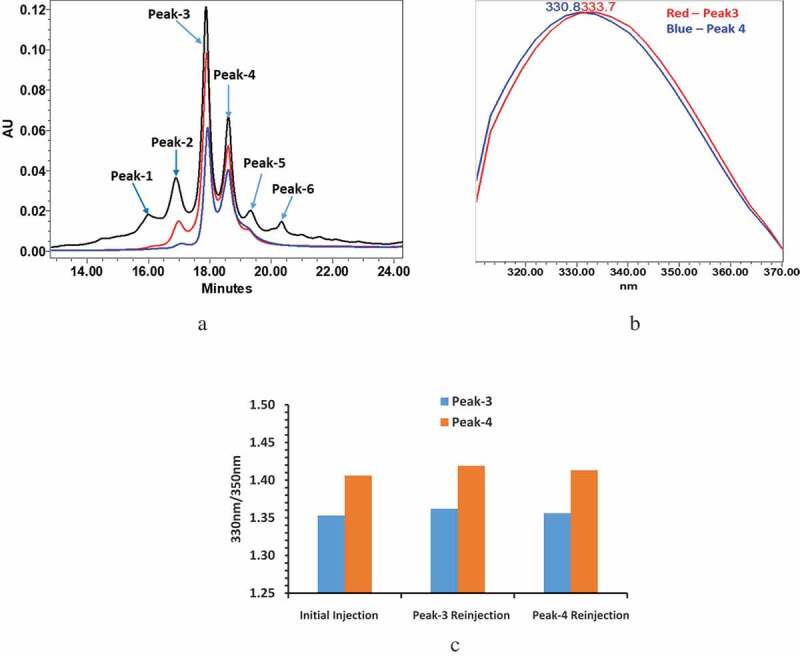
Figure 1.

mAb-1 demonstrated two main peaks (Peak-3 and Peak-4) in CEX analysis using pH gradient elution. The two main peaks exhibited different intrinsic fluorescence and re-equilibrated to a ratio similar to that ratio of unfractionated sample following reinjection of collected individual main peaks. The fluorescence profiles of reinjected peaks were also compared with initial unfractionated sample, which remained unchanged. (a) CEX chromatograms: initial injection of intact mAb-1 in black, reinjection of collected peak-3 in red, reinjection of collected peak-4 in blue. (b) PDA fluorescence profileof peak-3 and peak-4. (c) Fluorescence profile of peak-3 and peak-4 measured by 330 nm/350 nm.
